Large U.S. truckload carriers are reducing the capacity of their fleets even further, trying to align with demand, which has been consistently decreasing. Trucking companies that committed to cutting back on their trucks have fulfilled those commitments, leading to a 0.8 percentage point drop in the Truckload Capacity Index (TCI), published quarterly by Bill Cassidy at the Journal of Commerce, which now stands at 74.9% for the first quarter. In the first quarter, large truckload carriers reduced their capacity in response to a softer market.
Get the clearest, most accurate view of the truckload marketplace with data from DAT iQ.
Tune into DAT iQ Live, live on YouTube or LinkedIn, 10am ET every Tuesday.
The Journal of Commerce Truckload Capacity Index measures the actual truck counts from a group of large publicly owned truckload carriers, using their average truck count from the fourth quarter of 2006 as a baseline. The TCI index has decreased by 18.3 percentage points from its mid-2022 peak and is at its lowest level since the third quarter of 2014. The index is based on the truck count from the fourth quarter of 2006.
Load-to-Truck Ratio
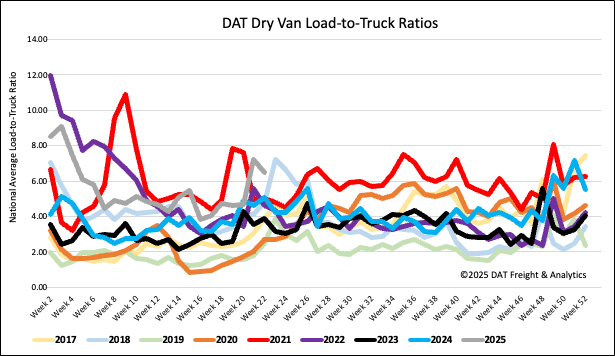
Following the typical post-Roadcheck Week pattern, dry van load post volumes decreased by over 11% last week. Simultaneously, the number of carriers posting trucks on DAT’s load board rose slightly by just over 1%, although it did not reach pre-Roadcheck Week levels. This observation reinforces a long-term trend of drivers extending their time off around significant industry events and public holidays. As a result, last week’s dry van load-to-truck ratio (LTR) was down 10% to 6.48, but the highest in nine years for Week 21.
Linehaul spot rates
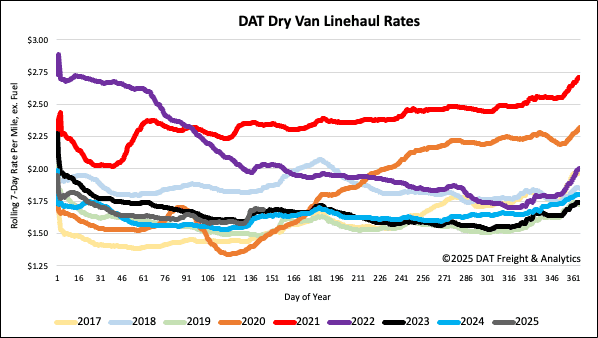
Dry van linehaul spot rates remained stable last week after the Roadcheck Week capacity tightening. The national 7-day rolling average finished at $1.70/mile, which is $0.05 higher than the same period last year and the same as in 2023.
The average rate on DAT’s top 50 lanes, based on load volume, was $1.99/mile. This is $0.03 higher than the previous week and $0.29 higher than the national 7-day rolling average spot rate.
In the 13 Midwest bellwether states, representing 45% of national load volume and closely mirroring the national average, outbound spot rates increased by $0.06 per mile with a 7% increase in outbound load volume. Carriers in this region received an average of $1.91/mile, $0.21 higher than the national 7-day rolling average.