The contract freight market, a key indicator of the industry’s health, continues to soften despite last month’s slight increase in the American Trucking Association’s (ATA) advanced seasonally adjusted (SA) For-Hire Truck Tonnage Index. The ATAs tonnage index, which includes truckload and LTL freight, is dominated by contract freight with minimal spot market loads. Compared to March 2023, the SA index fell 1%, the thirteenth straight year-over-year (y/y) decrease.
Get the clearest, most accurate view of the truckload marketplace with data from DAT iQ.
Tune into DAT iQ Live, live on YouTube or LinkedIn, 10am ET every Tuesday.
“Tonnage in March suggests that truck freight volumes remain lackluster, and it is clear the truck freight recession continued through the first quarter,” warned ATA Chief Economist Bob Costello. “In the first three months of 2024, ATA’s tonnage index contracted 0.8% from the previous quarter and declined 2.4% from a year earlier, highlighting the ongoing challenges the industry is navigating.”
ATA has calculated the tonnage hauled index based on surveys of its membership since the 1970s. Regarding the split between contract and spot freight, the latest data from DAT’s contract shipper consortium indicates around 15% of all loads are moving on the spot market this quarter, with the remainder on the contract market.
Market watch
All rates cited below exclude fuel surcharges unless otherwise noted.
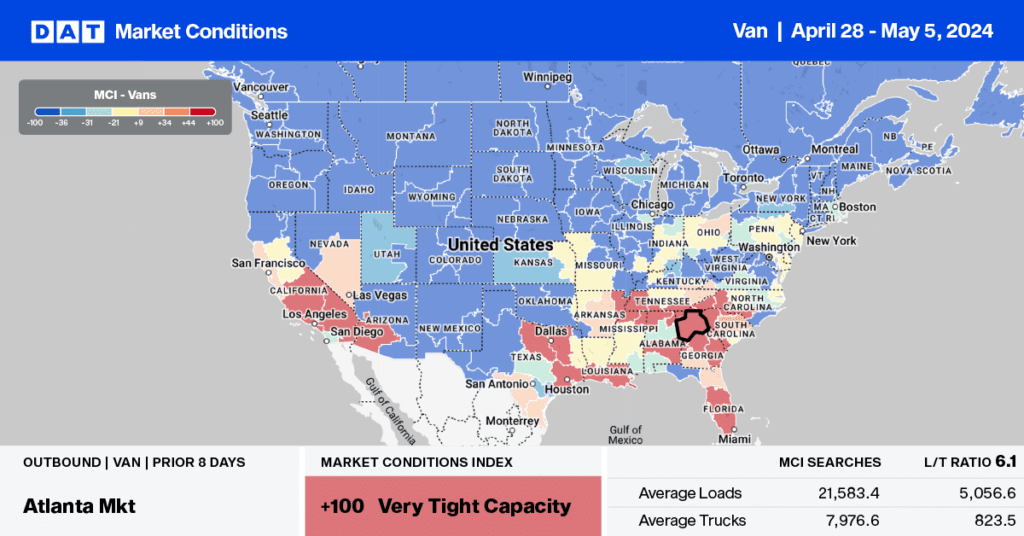
Last week, loads moved were flat in the nation’s Top five states for spot market volume: California, Texas, Illinois, Georgia, and New Jersey, while linehaul rates increased by $0.02/mile to a combined average of $1.70/mile. Solid gains were reported in California, where loads moved increased by just over 1% last week, while linehaul rates for outbound loads increased by $0.05/mile to $1.90/mile, $0.04/mile higher than last year. On the Los Angeles benchmark lane north to Stockton, loads moved jumped by 15% w/w, while spot rates increased by $0.04/mile to $2.58/mile, almost $0.06/mile lower than last year.
Similar gains were reported in Georgia, where rates increased by $0.05/mile to $1.69/mile last week on a 2% higher volume of loads moved. On the high-volume lane south to Lakeland, loads moved were down 1% w/w, with spot rates flat at $2.48/mile. As the produce season heads toward the late May peak in Florida, dry van capacity was tighter last week; Florida outbound linehaul rates were up $0.06/mile to $1.16/mile but trailing 2019 and last year by almost $0.10/mile.
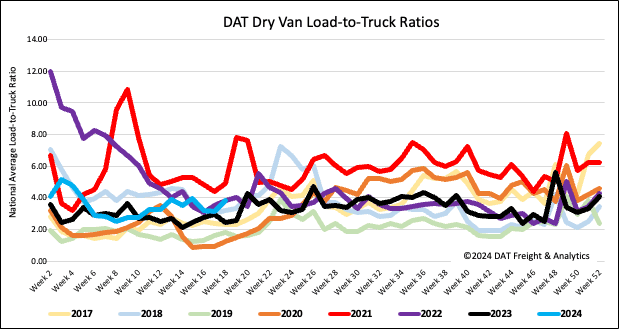
Load-to-Truck Ratio
Dry van load post volume was the highest in six weeks, following last week’s 11% end-of-month increase. Volumes are around 6% higher than last year, while equipment posts reversed course, decreasing by 8% w/w, resulting in the dry van load-to-truck ratio increasing by 21% w/w to 3.81.
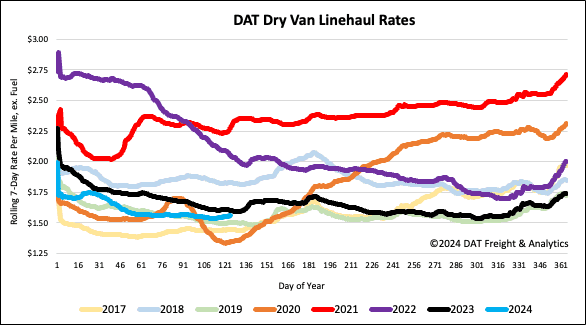
Linehaul spot rates
After drifting down slightly for the last five weeks, the national average dry van linehaul rate increased by just over a penny per mile to $1.57/mile last week. Compared to last year, linehaul rates are $0.05/mile lower on a 12% higher volume of loads moved.