According to data from the Commerce Department, Arizona is recognized as the capital of foreign trade zones in the United States, with the highest number of employed workers in this sector compared to any other state. It has also become a key destination for the increasing volume of imports from Asia that arrive in Los Angeles and are transported east by truck. Recently, many companies have been utilizing foreign trade zones to defer tariff payments on imported goods until the items are sold. This strategy improves cash flow and helps avoid supply chain bottlenecks as tariffs continue to rise. Phoenix stands out as a prime safe haven for these activities.
Get the clearest, most accurate view of the truckload marketplace with data from DAT iQ.
Tune into DAT iQ Live, live on YouTube or LinkedIn, 10am ET every Tuesday.
Arizona’s strategic location provides direct access to California, Mexico, and other western U.S. markets, with over 86 million people reachable within a one-day truck haul. The state has major interstate highways (I-10 and I-40), multiple Class I railroads, and international airports, making it an ideal logistics and distribution hub. Currently, dry van freight volumes between Los Angeles and Phoenix are over 30% higher than last year, and an additional surge in truckload demand is anticipated in the coming weeks.
In terms of warehouse space and volume, Arizona ranks among the top 10 markets. In 2020, it was named the leading growth market in North America for large-warehouse leasing activity, driven by the pandemic-induced surge in retail imports. Additionally, Phoenix has developed into the longest-standing semiconductor hub in the U.S., with companies such as Motorola, Intel, Microchip, NXP, OnSemi, and most recently, TSMC, calling Phoenix home. Together, these firms employ nearly 20,000 people.
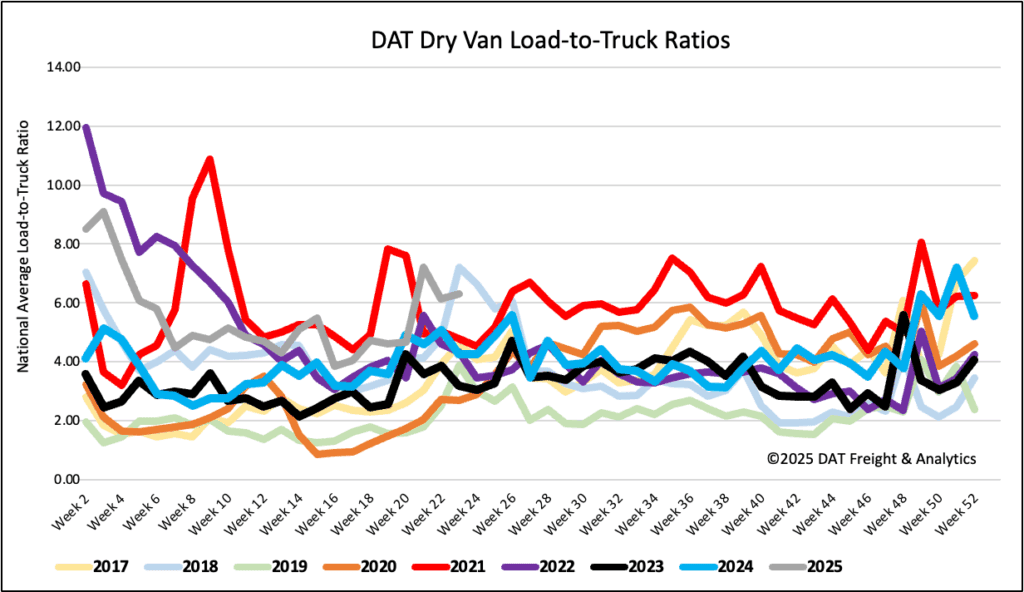
Load-to-Truck Ratio
Dry van load post volumes saw their second consecutive weekly decline, dropping by 14% and falling 6% below last year’s figures. Concurrently, the number of carriers listing trucks on DAT’s platform decreased by 17% week-over-week. This combination led to a 3% increase in the dry van load-to-truck ratio (LTR) last week, reaching 6.29.
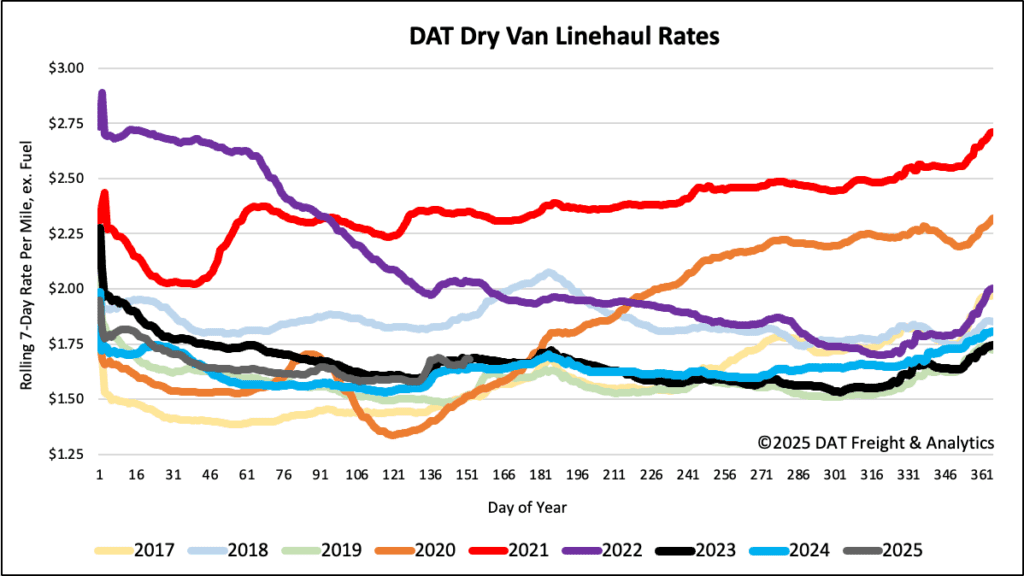
Linehaul spot rates
Dry van linehaul spot rates decreased by a penny per mile at month end, averaging $1.69/mile last week, which is $0.04 higher than the same period last year and the same as in 2023.
The average rate on DAT’s top 50 lanes, based on load volume, was $2.00/mile. This is $0.01 higher than the previous week and $0.31 higher than the national 7-day rolling average spot rate.
Across 13 bellwether Midwest states, which account for 44% of the nation’s load volume and typically reflect national trends, outbound spot rates declined by $0.02 per mile alongside a substantial 23% drop in outbound load volume. Carriers operating in this key region averaged $1.89 per mile, which is $0.20 above the national 7-day rolling average.