The U.S. Bank Freight Payments Index is based on more than $46 billion in freight payments annually and provides a quarterly look at the domestic truckload and less-than-truckload freight market. There were some mixed signals in the recently published first-quarter report for 2023. Even though the volume of shipments decreased by just over 6% compared to the first quarter of 2022, the rate of decrease was much lower than the 7.1% y/y drop in the last quarter of last year. According to the report, not all regions fell in unison, “some regions exhibited strength during the quarter, suggesting capacity has loosened overall, but there are still regions where capacity appears tighter.”
For at least the last 12 months, DAT Freight & Analytics has been observing a much stronger spot market in the Southwest, driven mainly by the shift in containerized and breakbulk imports into Gulf Coast ports. Texas has been a standout state where outbound flatbed spot rates have been consistently higher, and rates are slightly higher than in 2018, a standout year for open deck carriers.
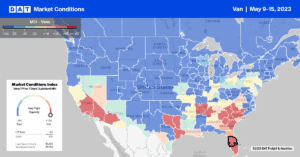
Compared to the first quarter of last year, only the Southwest (14.0%) saw an increase in freight volume – significant declines in shipments were reported in the Southeast (-16.1%), the West (-14.1%), and Northeast (-13.8%). “The Southwest had the best quarter, with shipments rising 5% from the fourth quarter. Solid gains in truck transport trade with Mexico helped boost shipments in the Southwest, especially at the port in Laredo,” according to U.S. Bank.
Find loads and trucks on DAT One, North America’s largest on-demand freight marketplace.
All rates cited below exclude fuel surcharges unless otherwise noted.
Following April’s 20% m/m increase in import containerized volume at the Ports of Long Beach and Los Angeles, Los Angeles, and Ontario have returned to the Top 5 freight markets. 7% more spot market volume in the Los Angeles market last week has resulted in capacity tightening for the fourth week. At $1.66/mile for outbound loads, spot rates have increased by almost $0.10/mile in the last month. In the Inland Empire market, spot rates in Ontario increased by $0.02/mile to $1.72/mile the previous week. State-level outbound spot rates for California are currently averaging $1.90/mile, around $0.10/mile higher than in 2019.
Atlanta, the most extensive distribution market in the Southeast and the number one spot market last week, volumes decreased by 7%, with outbound capacity remaining flat at $1.66/mile. Loads north to Elizabeth, NJ, at $1.89/mile, are currently $0.26/mile higher than the April average, while loads south to Orlando are at the lowest in 12 months at $2.18/mile, almost $1.00/mile than the previous year. Outbound capacity tightened again in Miami, where spot rates increased $0.05/mile to $1.14/mile, up $0.14/mile in the last month.
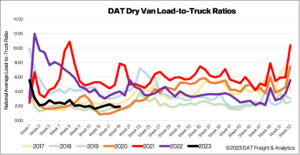
Load posts increased by just 2% last week and 9% in the previous month but remain at around half what they were a year ago. Volumes are identical to 2017, 23% higher than this time in 2019, and approximately 2% higher than the Week 19 long-term average. Equipment posts decreased by 2% w/w, increasing the dry van load-to-truck ratio (LTR) slightly from 1.84 to 1.92.
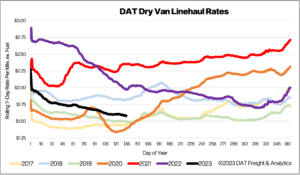
After being flat for the last few weeks, dry van linehaul spot rates decreased by just over a penny per mile last week. At $1.60/mile, excluding the fuel surcharge, the national average dry van rate is holding around $0.10/mile above 2019 levels. Based on the volume of loads moved, the average rate for the top 50 dry van lanes was $0.23/mile higher at $1.83/mile last week.


