Dry van volumes dropped and took pressure off of spot rates last week, with declines across the board, though demand remains above where they were a year ago.
The most recent For-Hire Trucking Ton-Mile Index from Michigan State University mirrored those trends. The seasonally unadjusted index declined 3.4% in November from October due to the Thanksgiving holiday.
However, demand for trucking services was 2.0% higher in November 2020 than November 2019 recording the highest ever reading. The latest paint clearly shows, “trucking has experienced a V-shaped recovery and is poised for a strong 2021”, according to Jason Miller, Associate Professor at MSU.
Find dry van loads and trucks on the largest on-demand freight marketplace in North America.
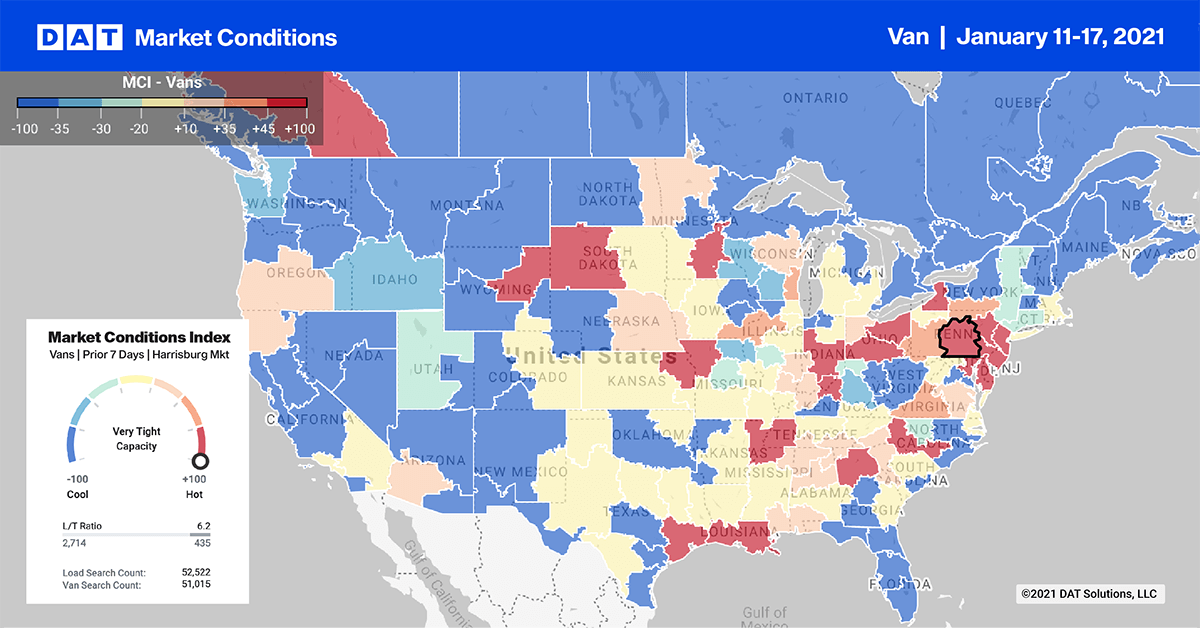
The top 10 dry van markets represent around a quarter of total load post volumes each week with Memphis (#1), the logistics hub of the U.S. freight market, recording the highest volume last week. As was the case in most markets, spot rates dropped by $0.06/mile to $2.50/mile for outbound loads from Memphis. In Atlanta (#5) volumes dropped 20% w/w driving down spot rates by $0.13/mile.
Available capacity continues to loosen on the West Coast where rates dropped $0.25/mile in Ontario, CA (#20) and $0.16/mile in Los Angeles (#29) – load post volumes dropped 18% and 27% w/w respectively. After holding down the top two spots for much of 2020 following the surge in Asian imports, Los Angeles and Ontario load post volumes are now down to pre-pandemic levels recorded in February 2020 and for most of 2019.
Spot Rates
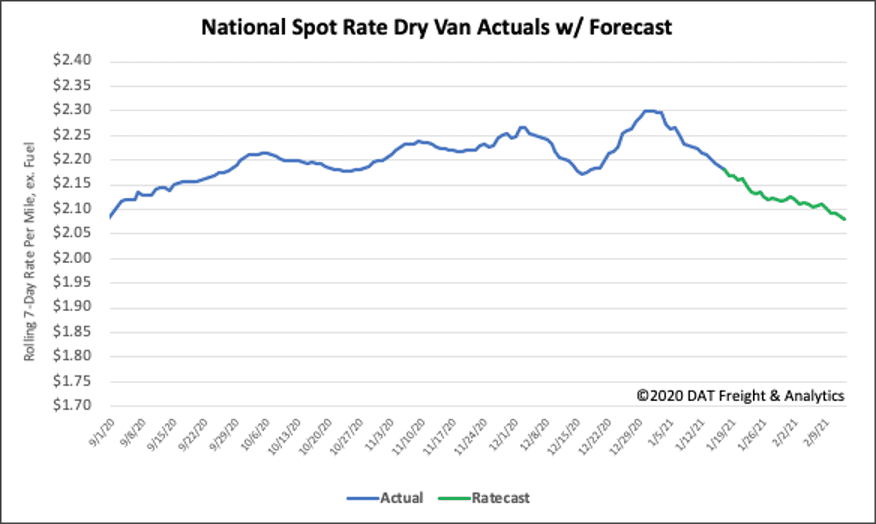
Dry van rates exhibited seasonality last week, decreasing by $0.04/mile to end week three at $2.18/mile excl. FSC. Even though rates typically decrease throughout January each year, this year they are starting off $0.60/mile higher than the same week in 2020 when they were $1.58/mile excl. FSC.


