A reliable barometer for flatbed carriers is the monthly count of new building permit applications and new housing starts. In August, single-family housing starts, which make up the largest share of the housing market and are the most freight-intensive for flatbed carriers, dropped 2.8% since July to a total of 1,076,000 homes.
Find loads and trucks on the largest load board network in North America.
Note: All rates exclude fuel unless otherwise noted.
Although it’s the second straight month of declining numbers, it’s still up 5.3% — or an additional 54,000 new single-family — homes compared to last August. In contrast, building permit applications, a leading indicator of future flatbed demand, increased by just 0.6%.
Single-family starts dropped in the West and Midwest, to 20.47% and 12.50% respectively while the Northeast reported at 10.3% gain. In the densely populated South Region where 60% of new single-family starts commenced in August, 17,000 new homes began construction. This represents a 2.55% monthly and 24.1% annual increase.
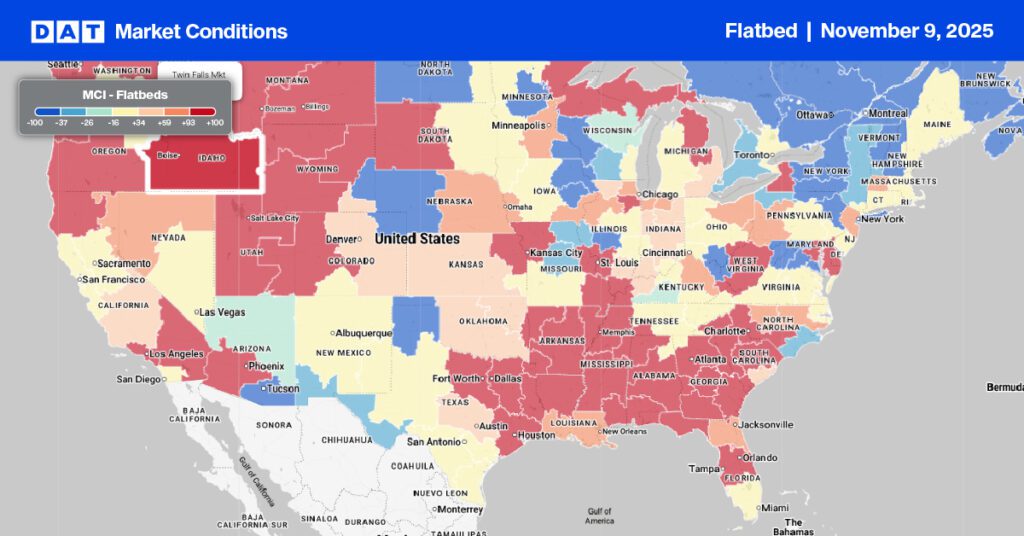
With the Atlantic hurricane season entering its second half and on track to be an above average season, it’s reasonable to assume flatbed demand will remain strong through year-end.
Outbound load volumes from the Lakeland, FL market have been climbing for the last five weeks after last week’s 10% increase. Even though average outbound spot rates remained flat at $2.23/mile last week, capacity tightened on the high volume lane to Atlanta. Rates increased by $0.15/mile to over the August average to $1.83/mile last week.
On the 654-mile lane from Lakeland to New Orleans, which is still recovering following Hurricane Ida, rates were up to $2.05/mile last week, which is $0.24/mile higher than the August average.
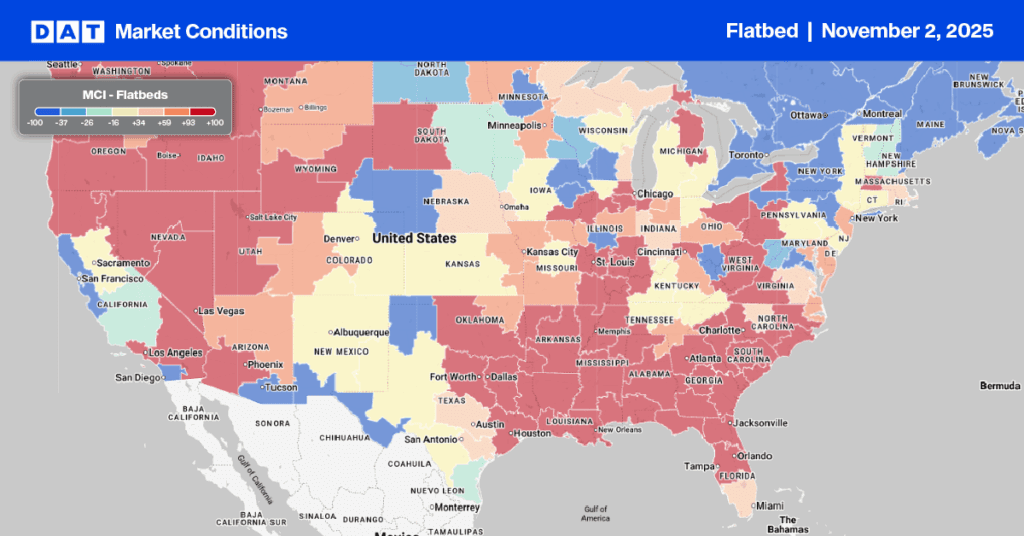
In Memphis, the logistics capital of the U.S. where major railroads and interstate highways intersect, load post volumes were up 15%, but capacity continues to ease with spot rates dropping $0.10/mile to an average outbound rate of $3.29/mile.
Spot rates
The flatbed sector continued to oscillate last week with spot rates shifting up by a penny per mile following the prior week’s decrease by the same amount. The flatbed national average spot rate ended last week at $2.66/mile. Spot rates are now 17% or $0.46/mile higher than the same week last year. Compared to the same time in 2018, flatbed spot rates are $0.52/mile higher.
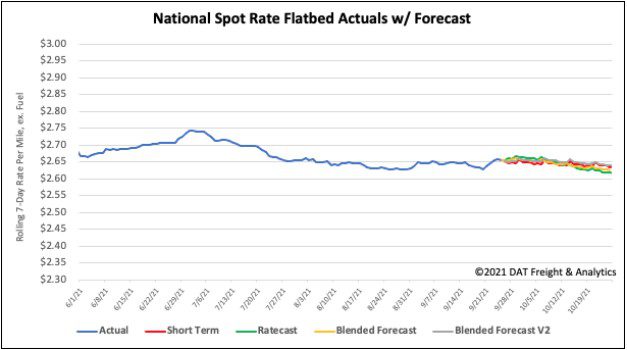
How to interpret the rate forecast:
- Ratecast: DAT’s core forecasting model
- Short Term Scenario: Formerly the pessimistic model that focuses on a more near-term historical dataset
- Blended Scenario: More heavily weighted towards the longer-term models
- Blended Scenario v2: More heavily weighted towards the shorter-term models