Amid recent fluctuating tariff announcements, “economic uncertainty” is a prominent concern in the trucking industry. Despite U.S. tariffs largely exempting energy imports and minimal market impact from Chinese tariffs on U.S. energy products thus far, the energy sector, like others affecting flatbed carriers, is generally delaying large investment decisions and proceeding cautiously with significant projects.
Get the clearest, most accurate view of the truckload marketplace with data from DAT iQ.
Tune into DAT iQ Live, live on YouTube or LinkedIn, 10am ET every Tuesday.
Project slippage rates from IIR Energy, a global market research leader, offer a way to evaluate this macroeconomic impact by comparing a project’s expected kickoff date to when work begins. IIR monitors industrial manufacturing projects nationally in sectors such as Data Centers, Heavy Manufacturing, Power Generation, and Transmission and Distribution, comparing anticipated and actual start dates.
IIR data reveals a sharp increase in U.S. project slippage rates this year, averaging 6.5 months longer than a year ago. In March, the average slippage was 12.6 months for Power Generation, 6.5 months for Data Centers, and 5.7 months for Heavy Manufacturing.
This overall project slippage data suggests that in the current climate of limited risk tolerance, companies might be slowing down, temporarily stopping, or canceling projects.
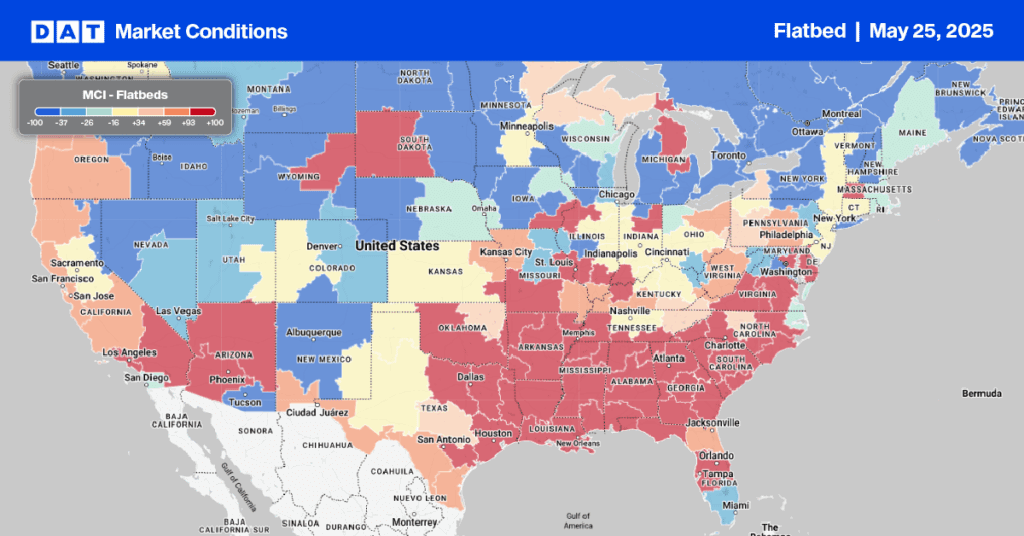
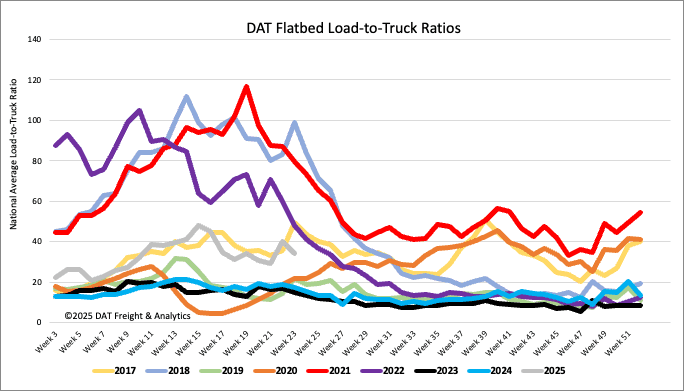
Load-to-Truck Ratio
Last week, flatbed load post volumes fell by 2% but were still 18% above last year’s levels and nearly the same as the historical average for Week 21. Following the Roadcheck Week capacity reduction, carrier equipment posts increased by 14%. Consequently, the flatbed load-to-truck ratio decreased by 14% week-over-week to 34.27.
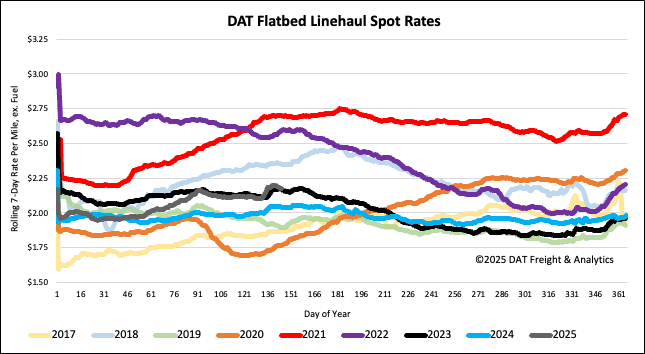
Spot rates
Last week, the average flatbed spot rate excluding fuel decreased by $0.02/mile to $2.19/mile. This rate is $0.14/mile higher than the same week last year and equal to the average in 2023.