The U.S. Energy Information Administration (EIA) has reported that oil production from major shale regions in the United States reached a six-month high in June. The EIA anticipates that production in the leading shale basins will rise to 9.85 million barrels per day (mbpd), marking the highest output since December 2023.
Get the clearest, most accurate view of the truckload marketplace with data from DAT iQ.
Tune into DAT iQ Live, live on YouTube or LinkedIn, 10am ET every Tuesday.
Mansfield Energy has indicated that the increase in shale production, which makes up about three-quarters of total U.S. oil output, is due to improved well productivity. The Permian Basin, the largest U.S. oilfield spanning West Texas and New Mexico, plays a crucial role in this increase. It is projected to raise production per new rig to 1,400 barrels per day (bpd) in June, up from 1,386 bpd in May.
According to the latest rig count from Baker Hughes, a key indicator for the drilling industry and flatbed carriers, the rig count in the Permian Basin was 9.6% lower than last year. Consequently, fewer loads of drill pipe and casing are being transported due to fewer drilling rigs being constructed. Loads moved from Houston to Lubbock, TX, the top flatbed lane in the nation, are 10.5% lower than last year.
Market watch
All rates cited below exclude fuel surcharges, and load volume refers to loads moved unless otherwise noted.
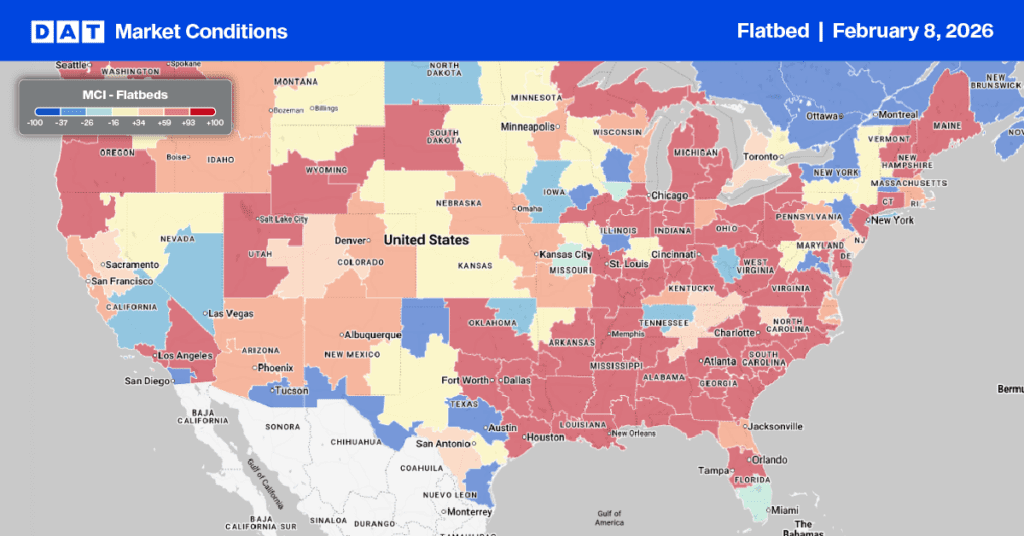
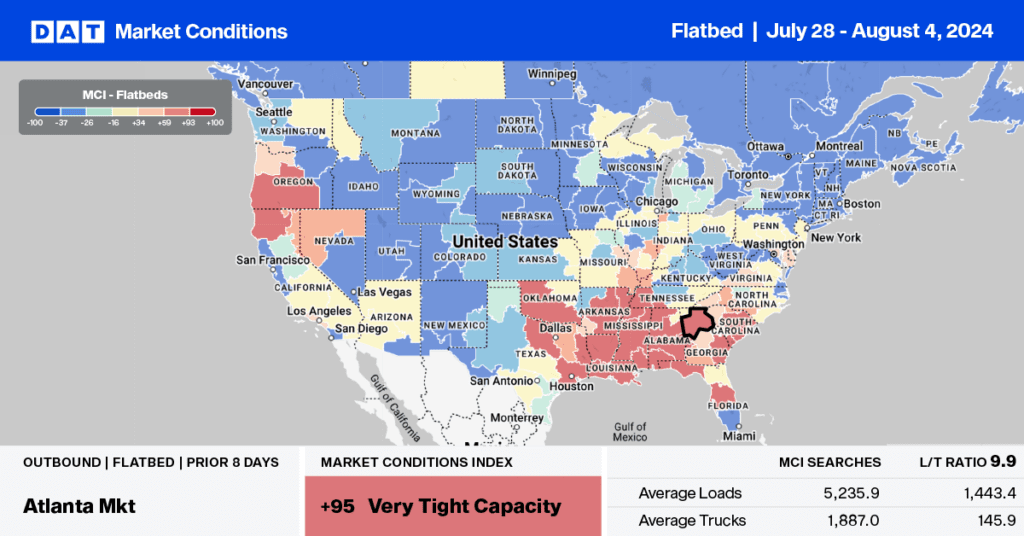
Last week, flatbed capacity remained tight in Illinois. The state-average linehaul rates for outbound loads increased by a penny per mile to $2.24/mile, which is the same as 2019 but $0.15/mile lower than last year. In the larger Chicago market, capacity was the tightest, with a 32% increase in loads moved, leading to a $0.06/mile increase in outbound linehaul rates to $2.23/mile. On the regional lane west to Minneapolis, flatbed capacity was extremely tight after a $0.29/mile spike in linehaul rates, averaging $2.56/mile on a 12% higher volume.
Load-to-Truck Ratio
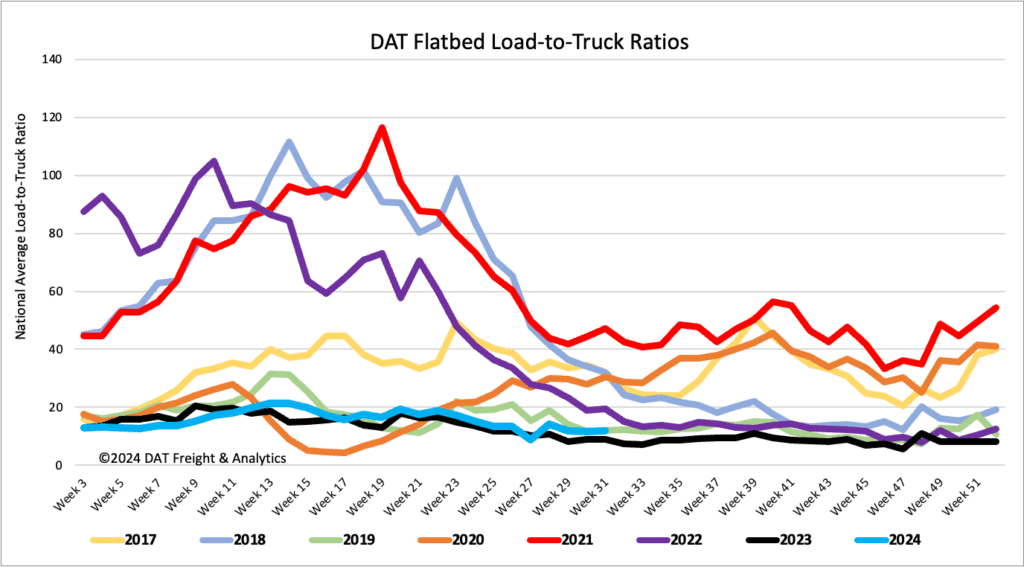
Flatbed load post volumes dropped by 5% last week and remain 2% higher than last year and 39% lower than the Week 31 eight-year average, excluding years impacted by the pandemic. Carrier equipment posts were again down 8% w/w, resulting in last week’s flatbed load-to-truck ratio remaining at 11.8, almost identical to 2019.
Spot rates
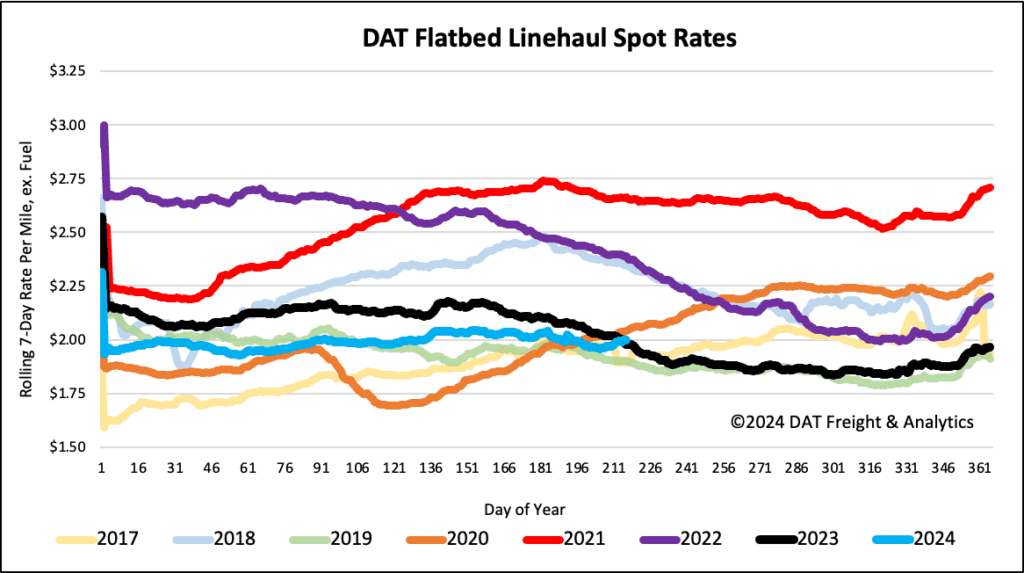
Even though the volume of loads moved and loads posted dropped by 1% and 8% last week, respectively, flatbed capacity tightened, increasing linehaul rates by just over $0.02/mile. Flatbed spot rates are $0.02/mile higher than last year but $0.10/mile higher than 2019.
