According to energy services firm Baker Hughes, U.S. energy firms have reduced the number of natural gas rigs operating to the lowest level since January 2022. The combined oil and gas rig count, an early indicator of future output, fell by three to 621 in the week to March 28. The Baker Hughes Rig Counts are an important business barometer for the drilling industry and its suppliers, including flatbed carriers. The active rig count is a leading indicator of demand for products used in drilling, completing, producing, and processing hydrocarbons.
Get the clearest, most accurate view of the truckload marketplace with data from DAT iQ.
Tune into DAT iQ Live, live on YouTube or LinkedIn, 10am ET every Tuesday.
The Baker Hughes total rig count is down 134, or 18%, from this time last year. The number of oil rigs fell by three to 506 this week, while gas rigs remained at 112, their lowest level since mid-January 2022. Reuters reports, “The oil and gas rig count dropped about 20% in 2023 after rising by 33% in 2022 and 67% in 2021, due to a decline in oil and gas prices, higher labor and equipment costs from soaring inflation and as companies focused on paying down debt and boosting shareholder returns instead of raising output.”
According to Baker Hughes data, 67% of oil rigs are in the Permian Basin in West Texas, the largest drilling region in the country, where oil rig counts have dropped 11% in the last year. In the Eagle Ford basin in Southwest Texas, rig counts are down 19% year-over-year (y/y) while rig counts in neighboring Louisana have dropped by 37% y/y, although only accounting for 5% of total rigs.
Market watch
All rates cited below exclude fuel surcharges unless otherwise noted.
Outbound flatbed capacity remains tight in Baltimore, one of DAT’s largest spot markets on the East Coast, this time of the year. Flatbed linehaul rates have recently increased by $0.12/mile, following last week’s $0.04/mile gain to an average of $2.34/mile. The volume of loads moved increased by just over 1% last week. On the number one flatbed lane between Baltimore and South Bend, IN, load volume increased by 3% w/w while carriers were paid an average of $2.03/mile, up $0.05/mile last week.
In Shreveport, LA, capacity was extremely tight last week; spot rates surged by $0.27/mile on a 22% lower volume of outbound loads. Trucks were scarce on the regional lane west to Houston, where linehaul rates were the highest in 12 months following last week’s $0.38/mile increase to $3.06/mile on an 11% lower volume.
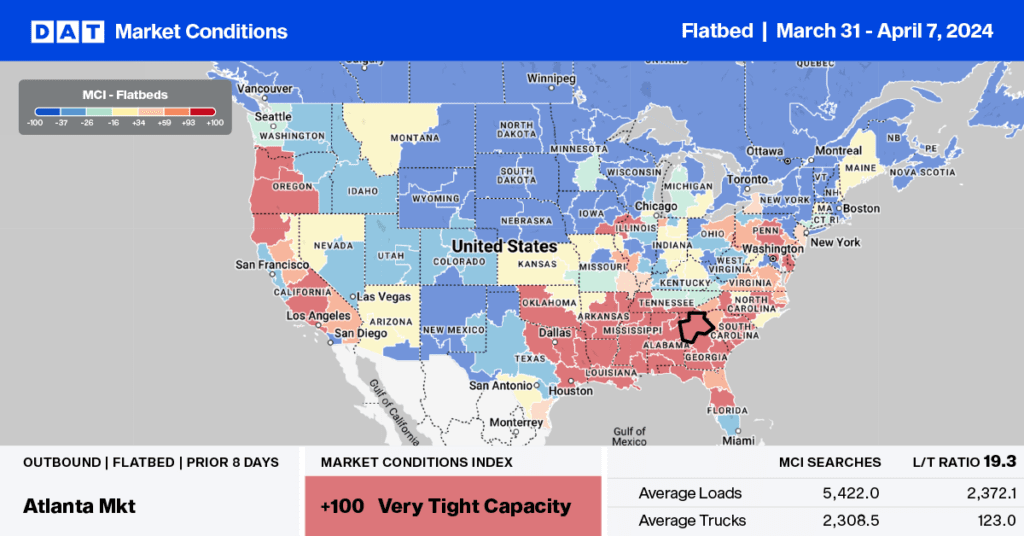
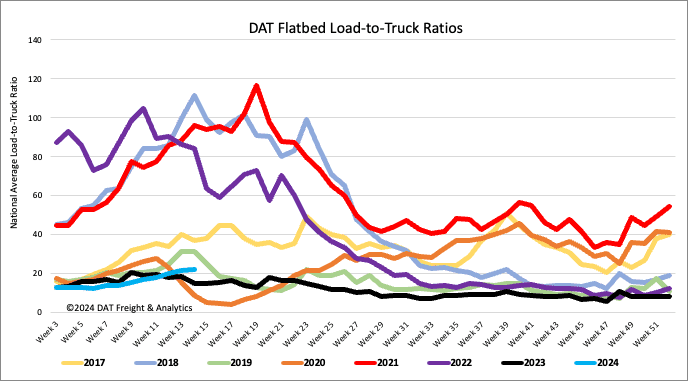
Load-to-Truck Ratio
Flatbed load post volumes were flat last week after increasing for the prior seven weeks and are 10% higher than last year. Available capacity decreased following the 4% decrease in equipment posts, increasing the load-to-truck ratio by 3% to 22.08.
Spot rates
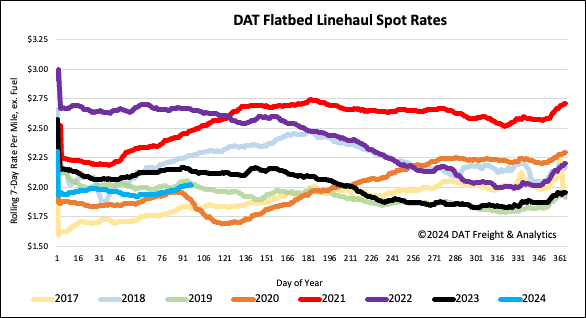
After increasing for all of March, the volume of flatbed loads moved dropped back following last week’s 15% w/w decline. However, available capacity continues to tighten, with flatbed spot rates up by just under $0.01/mile last week to a national average of $2.03/mile. Flatbed linehaul rates are $0.12/mile lower than last year and $0.01/mile lower than in 2019.
