In April, residential housing construction for single-family homes was mostly flat sequentially but still 22% higher than last year. For flatbed carriers looking for demand signals of an improving truckload market, the April result shows the market is in a holding pattern now the Federal Reserve has indicated rate cuts may not occur this year as expected.
Get the clearest, most accurate view of the truckload marketplace with data from DAT iQ.
Tune into DAT iQ Live, live on YouTube or LinkedIn, 10am ET every Tuesday.
According to the U.S. Census Bureau, starts were at an annual rate of 1.36 million, 5.7% higher than the downwardly revised March number of 1.29 million. Permits, meanwhile, came in at 1.44 million, down from the upwardly revised 1.485 million in March. Both were slightly below the comparable month in 2023.
“However, homebuilders are starting to feel less confident as mortgage rates hover around 7% and consumer confidence starts to weaken. This year permits for constructing new single-family homes reflecting future building activity are also higher. Still, the year-over-year increase in permit activity has slowed,” said Bright MLS Chief Economist Lisa Sturtevant.
For flatbed carriers, April’s construction of 1.3 million single-family homes translated into approximately 620,000 loads, 110,400 more than April last year and 74,000 more loads than the booming 2018 flatbed market.
Market watch
All rates cited below exclude fuel surcharges unless otherwise noted.
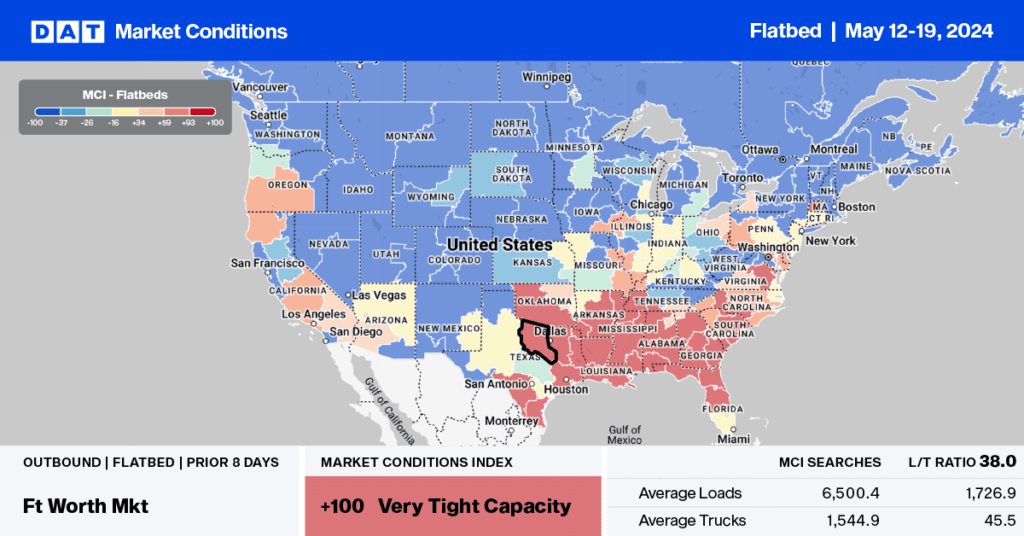
U.S. energy firms added oil and natural gas rigs for the first time in four weeks this week, according to Energy Services firm Baker Hughes’s closely followed report on Friday. The oil and gas rig count, an early indicator of future flatbed demand, rose by one to 604 in the week to May 17. Despite this week’s rig increase, Baker Hughes said the total count was still down 116, or 16% below this time last year. Around half of the rig count is located in the West Texas Permian Basin, in the Lubbock freight market serviced mainly by flatbed capacity in Houston.
The volume of loads moving on the Houston to Lubbock lane was down 9% last week, while spot rates jumped by $0.15/mile to an average of $2.57/mile, just over $0.25/mile lower than last year. The same volume of loads moved. Houston to El Paso rates were up $0.10/mile w/w to $2.51/mile on a 13% lower volume. The Houston market recorded a $0.07/mile increase in spot rates last week, averaging $2.20/mile for outbound loads.
Load-to-Truck Ratio
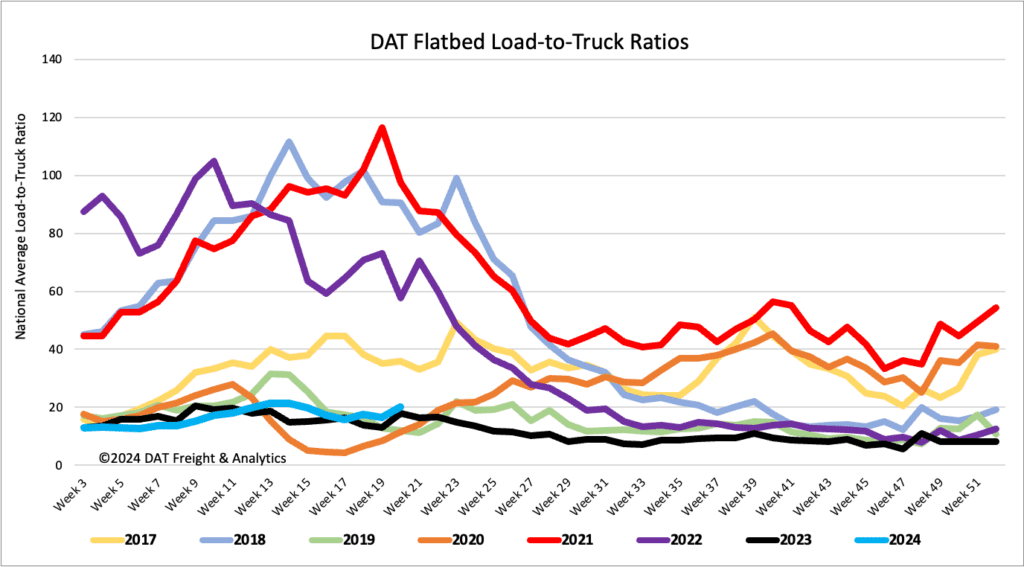
Flatbed load post volumes increased by 8% w/w, while equipment posts dropped by 11% w/w, increasing the load-to-truck ratio by 22% to 20.05
Spot rates
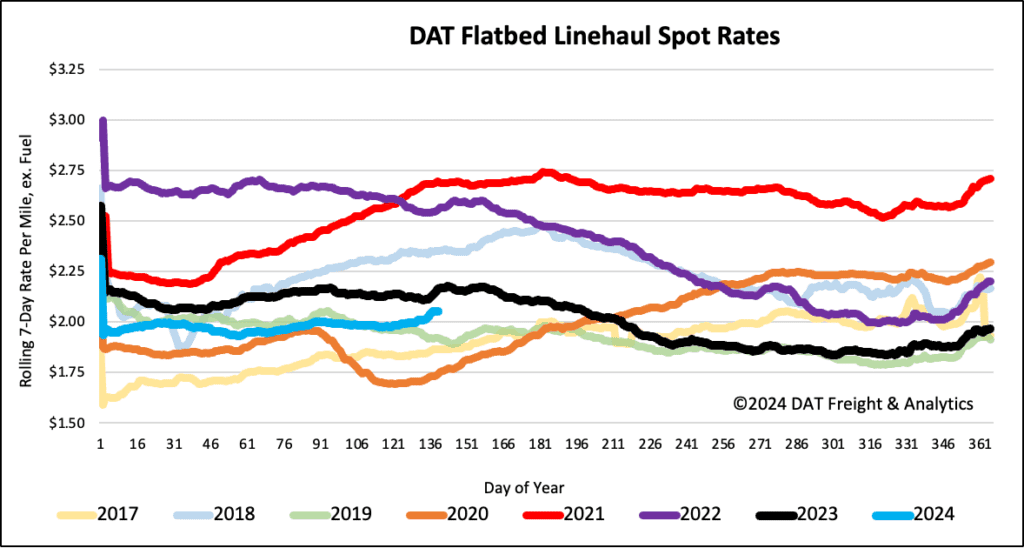
After remaining flat for three weeks, flatbed linehaul rates increased by $0.03/mile last week to a national average of $2.06/mile. The national average is $0.11/mile lower due to an 18% higher volume of loads moved than last year.
