Sun-drenched Western states have a solar energy boom, which means a substantial volume of inbound freight for flatbed carriers. As of July last year, nearly 100 solar plant applications were pending in Nevada, creating what conservationists call an energy industrial revolution. According to Greg Helseth, renewable energy branch chief at the Nevada state office of the Bureau of Land Management (BLM), “There are 96 pending solar plant applications across the state, with 51 in Southern Nevada.”
Get the clearest, most accurate view of the truckload marketplace with data from DAT iQ.
Tune into DAT iQ Live, live on YouTube or LinkedIn, 10am ET every Tuesday.
Utility-scale energy development has been ongoing over the last decade in Arizona, California, Colorado, Nevada, New Mexico, and Utah, with more recent developments in Nevada capturing headlines. The Gemini Project in Clark County, NV, just 35 miles northeast of Las Vegas, is one of North America’s largest solar photovoltaic (PV) and battery energy storage projects.
The southwest desert has some of the highest solar radiation levels in the world, explaining in part the increase in inbound truckload freight in recent years. Since 2019, the average weekly inbound loads to Nevada have doubled.
Market watch
All rates cited below exclude fuel surcharges unless otherwise noted.
After three weeks of gains, flatbed linehaul rates in Nevada decreased by $0.24/mile last week to a state average of $2.20/mile, almost identical to 2018. The volume of loads moving into Nevada is around 10% higher y/y, with carriers paid an average of $2.15/mile for inbound loads, much the same as in 2023. Solid gains were reported in the Las Vegas outbound market, where linehaul rates are 8% higher than last year following a 19% increase in the volume of flatbed loads moved. Las Vegas flatbed rates averaged $2.24/mile last week, while loads to Tucson, AZ, paid carriers $2.51/mile, the highest since last July.
Flatbed spot rates increased for the third week in Texas by $0.02/mile to $1.94, identical to the same week in 2018. The Dallas/Ft. Worth market reported an 11% w/w increase in loads moved, pushing up spot rates by 4% w/w to an outbound average of $1.77/mile. In Houston, spot rates increased by a penny per mile to $1.97/mile on 4% lower loads moved volume. The high-volume Houston to Lubbock lane reported 10% fewer loads moving last week, although capacity was tighter as spot rates increased by $0.03/mile to an average of $2.32/mile, which is $0.40/mile lower than last year.
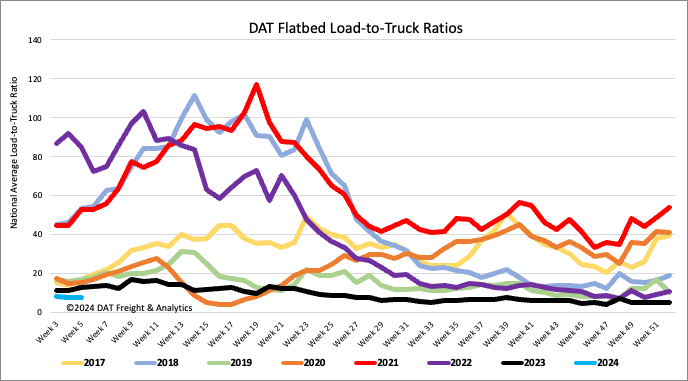
Load-to-Truck Ratio (LTR)
Flatbed load post (LP) volumes were the lowest in eight years following last week’s 9% decrease and half this time last year. Carrier equipment posts (EP) decreased by 6%, resulting in last week’s load-to-truck ratio decreasing by 3% to 7.66, the lowest flatbed LTR recorded since 2017.
Spot rates
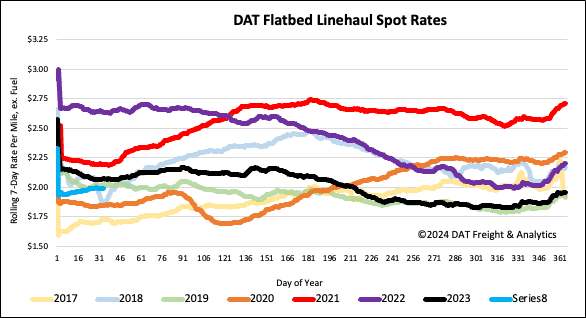
Since the start of this year, flatbed spot rates have increased by $0.05/mile, although they remained flat last week at a national average of $2.02/mile. Linehaul rates have increased by $0.15/mile since mid-November, exactly the same as they did in 2018. At $2.02/mile, linehaul rates are $0.08/mile lower than last year.