Seasonally adjusted trucking ton-mileage improved for the second consecutive quarter in Q1 2025, showing a 0.3% increase quarter-over-quarter and a 0.4% rise year-over-year. According to Prof. Jason Miller, “this growth was primarily fueled by increased output in chemical (excluding pharmaceuticals) and construction supplies (including wood products, nonmetallic minerals, and construction steel). Modest expansion in machinery production also contributed”. The strength in construction supplies and machinery aligns with the strong flatbed market conditions observed in Q1.
Get the clearest, most accurate view of the truckload marketplace with data from DAT iQ.
Tune into DAT iQ Live, live on YouTube or LinkedIn, 10am ET every Tuesday.
Conversely, beverage and paper manufacturing continued to weaken, contributing to ongoing softness in the dry van sector. The motor vehicle sector also experienced a year-over-year decline, and the fracking industrial complex saw further weakening, likely to be exacerbated by current oil prices.
While for-hire trucking activity showed an upward trend throughout Q1, April’s seasonally adjusted industrial production data for manufacturing indicated some weakening. The future performance of manufacturing will be crucial in determining whether demand improves enough to increase carrier capacity utilization and tender rejections. Tariff-induced uncertainty is a concern, potentially dampening previously forecasted improvements in manufacturing output for 2025.
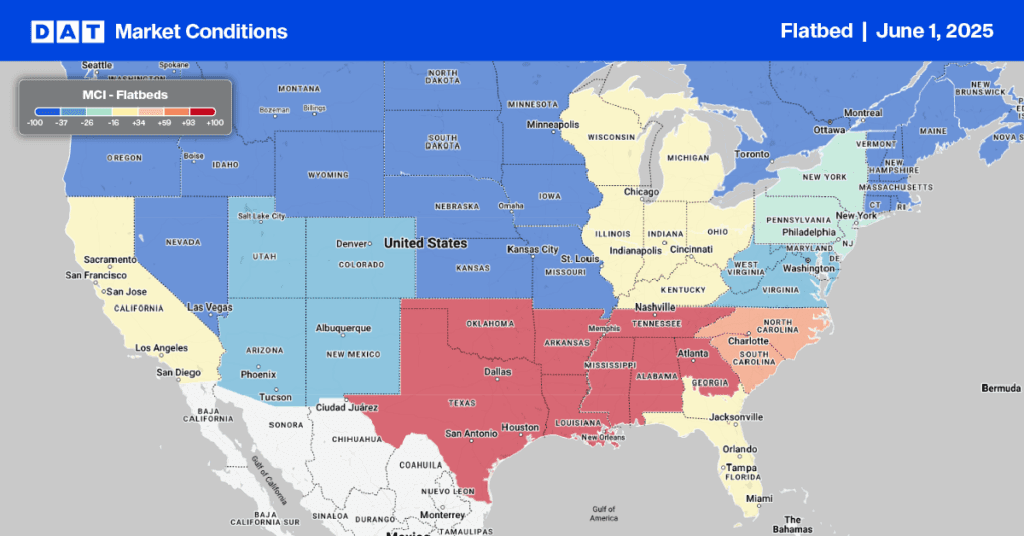
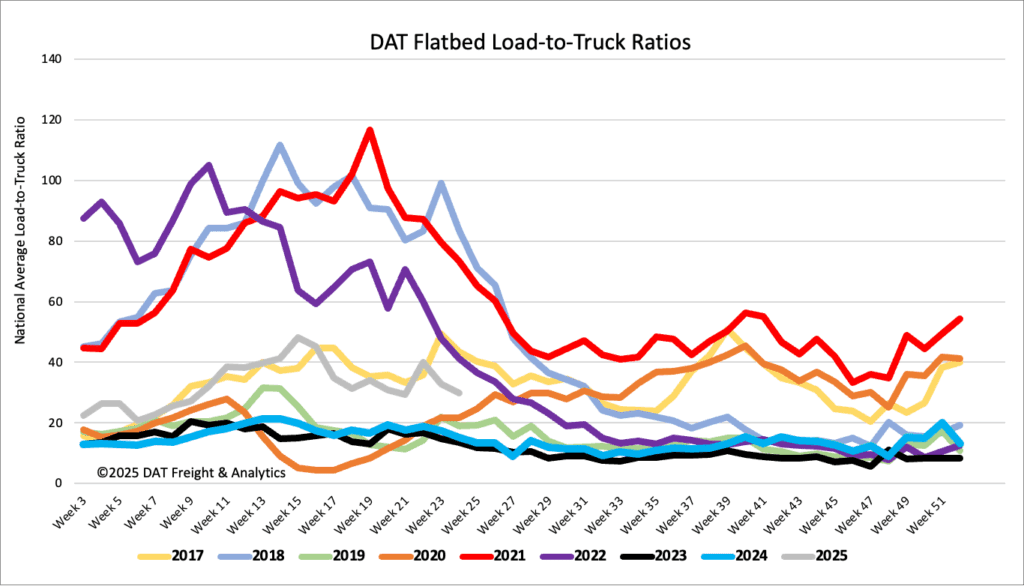
Load-to-Truck Ratio
Last week saw a significant 28% drop in flatbed load post volume, although it remained 2% higher than the same period last year. Simultaneously, flatbed carrier equipment posts fell by 20%. As a result of these shifts, the flatbed load-to-truck ratio experienced a 9% week-over-week decrease, settling at 29.92.
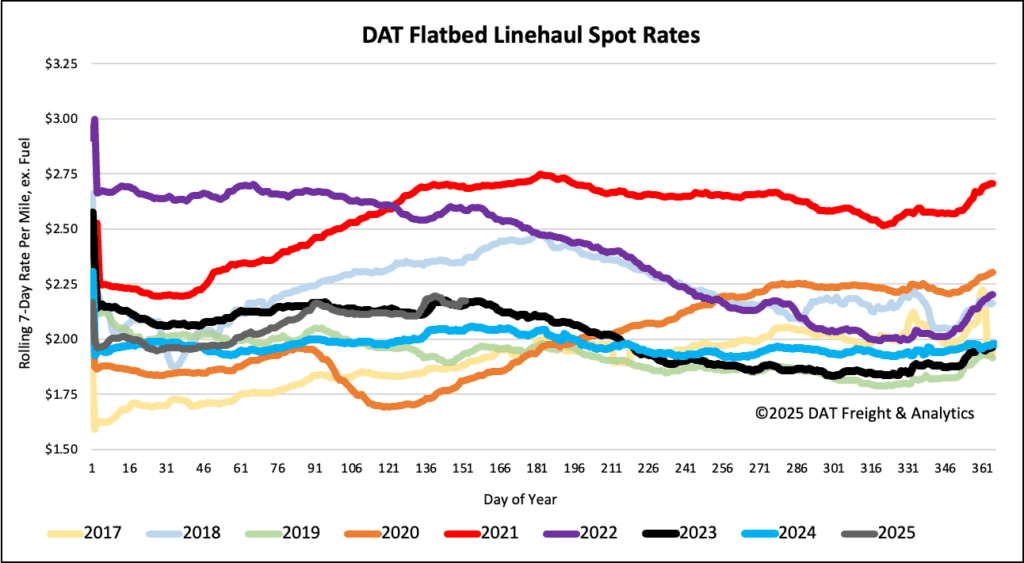
Spot rates
Last week’s average flatbed spot rate, excluding fuel, remained steady at $2.19 per mile. This is $0.12 per mile above the rate from the same week in 2024 and $0.02 per mile higher than in 2023.