Summer officially starts this week, and for truckers, that means construction season starts also. There are only two seasons for commercial truck drivers – winter and construction. We desperately need an upgrade to our highway infrastructure, so we have to take the good with the bad; better roads and bridges mean more delays in the meantime. With the November 2021 enactment of the Infrastructure Investment and Jobs Act, what better place to focus investment decisions than the American Transportation Research Institutes (ATRI) top 10 truck supply chain bottlenecks.
Each year ATRI lists the level of truck-involved congestion at over 300 national highway system locations. ATRI produces a congestion impact ranking for each location using location data from telematics devices (ELDs, etc.) from over 1 million trucks and other back-office data.
Get the clearest, most accurate view of the truckload marketplace with data from DAT iQ.
Tune into DAT iQ Live, live on YouTube or LinkedIn, 10am ET every Tuesday.
Surprisingly, Los Angeles is not at the top of the list.
According to the ATRI report, the intersection of Interstate 95 and State Route 4 in Fort Lee, New Jersey is the country’s No. 1 freight bottleneck for the fourth consecutive year. For those unfamiliar with the area, this intersection is just to the west of the famous George Washington Bridge that crosses the Hudson River, and for an 18-wheeler, it costs $110 in tolls to reach the other side.
2022 Top 10 Truck Bottlenecks
- Fort Lee, New Jersey: I-95 at SR 4
- Cincinnati: I-71 at I-75
- Houston: I-45 at I-69/US 59
- Atlanta: I-285 at I-85 (North)
- Atlanta: I-20 at I-285 (West)
- Chicago: I-290 at I-90/I-94
- Los Angeles: SR 60 at SR 57
- Dallas: I-45 at I-30
- San Bernardino, California: I-10 at I-15
- Chattanooga, Tennessee: I-75 at I-24
The ATRI analysis found traffic levels rebounded across the country as more Americans returned to work and consumer demand for goods and services continued to grow throughout 2021. For truckers wondering just how bad traffic delays are, the average peak hour speed in the top 100 bottlenecks is just 38.6 mph, which is 11.2% lower than the average in 2020. Almost half of the top 100 bottlenecks have an average speed lower than 45 mph, and 30 states have at least one bottleneck in the top 100 (see Figure 1).
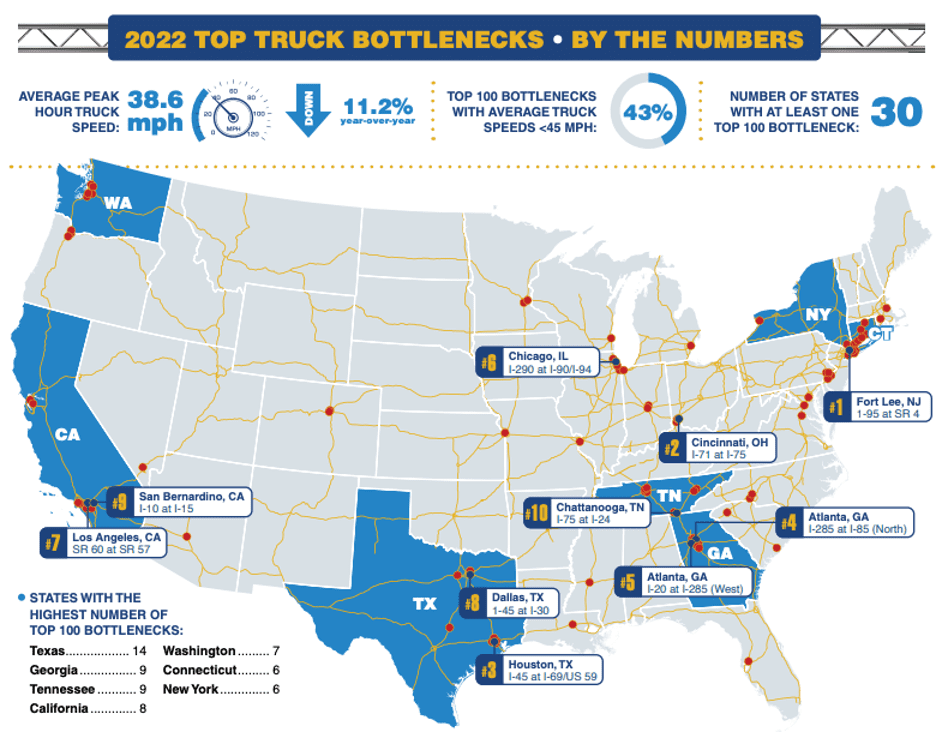
Figure 1: ATRI 2022 Top Truck Bottlenecks
Just how bad is the Fort Lee, NJ, bottleneck?
This location’s average speed is only 0.1% higher than in 2019, so traffic is just returning to normal. The average speed through this intersection is 30.1 mph, but during the peak hour rush, it drops 26% to just 22.4 mph. The worst time of the day is between 7 and 9 am, when the average speed drops to almost 15 mph. The best time is between 1 and 4 am for truckers looking to beat the traffic. But it’s not the slowest bottleneck; that honor goes to the I-90/I-94 interaction on I-290 in Chicago, where the average speed is 24.4 mph and 12 mph between 2 and 6 pm.
What’s the cost of delays to the trucking industry?
According to ATRI’s most recent report in 2018, the average cost of congestion to the trucking industry was close to $75 billion or about $6,500 per truck/year for short-haul carriers to as much as $32,250 for their long-haul counterparts. The hidden costs are higher though; delays lead to frustration, anger, road rage, and risk-taking by drivers, especially truckers trying to get in as many miles as possible before they run out of hours.


