While spot rates continue to spike, many motor carriers are making business decisions based on what they learned from 2018.
After the ELD mandate went into effect, truckload capacity tightened quickly, and rates hit all-time highs in mid-2018. That led to record levels of new truck and trailer orders, which created a much softer freight market in 2019. Carriers seem less willing to add extra capacity this time around. In talking to carriers this week, a common view expressed is that capacity won’t be added until COVID-19 is better under control and consumer demand becomes more predictable.
There are some concerning signs emerging for long-term demand in the consumer packaging goods (CPG) sector, which supports that cautious outlook. The latest report from the IRA CPG Demand Index, which tracks changes in spending on consumer packaged goods at the point of sale, shows a steady decline since its peak on June 21 and is now down 6% as of Aug. 16. Despite the recent steady decline, the CGP Demand Index is still up 8% year over year.
Edible items explain in part the recent spike in load posts and rates on the spot market. The latest IRI report shows sales growth in the edible food (including beverages, frozen, general food, alcohol and refrigerated goods) and fresh foods departments, with double-digit percentage growth compared to last year. Frozen goods report the strongest growth due to the longer shelf-life, allowing consumers to stock up and limit trips to the store during the pandemic. IRI also reports demand for bacon is up 20% y/y while shaving products sales are down 8% y/y, as more and more people work from home.
The Wall Street Journal reported that on a recent earnings call, Walmart executives noted consumers are nervous about their finances and job security in the absence of stimulus aid, leading to cutbacks in spending. IRI consumer spending data shows grocery shoppers are cutting back their food spending after $600 weekly additional unemployment benefit expired in July.
Consumer spending accounts for more than two-thirds of U.S. economic activity, making it a critical data point to watch in the coming weeks.
Dry van trends
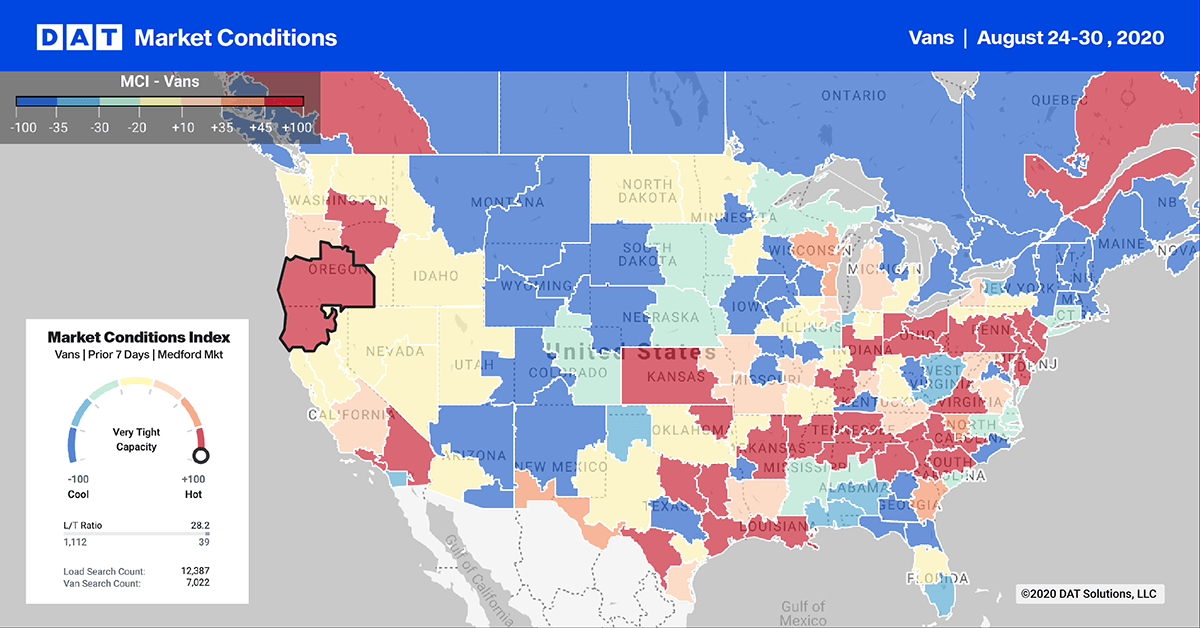
DAT iQ recently added analytical insights from the Freight Market Intelligence Consortium (FMIC), formerly part of Chainalytics. The August Pulse Signal report concluded that July contract freight volumes were flat, but instead of shippers moving 12-15% of their freight on the spot market like they do in non-pandemic times, 21% of their loads landed on the spot market last month.
This is a reflection of demand volatility and that carrier networks are still unbalanced, and while there are enough trucks out there, they are still not in the right places for shippers.
This could play out on the West Coast more so than anywhere else in the coming weeks, following Union Pacific Railroad’s announcement last week that effective 8/31, they plan to impose a surcharge of $3,500/container for shipper excess volume out of the Los Angeles market. This new surcharge applies to shippers exceeding their peak season contractual allotment, which is significant as about 30% of our imports arrive in Los Angeles and approximately 30% of all intermodal volume travels on the Los Angeles to Chicago lane.
Any tightening of intermodal capacity on the West Coast could force smaller shippers to switch back to truckload for longer-haul freight volume. Up until last Sunday, truckload volumes out of Los Angeles were already trending up 3% m/m, with rates climbing 5% m/m.
Hurricane Laura made landfall last Wednesday along the Gulf Coast, which resulted in New Orleans and Houston inbound load volumes spiking by 26% w/w as emergency agencies staged relief supplies. In contrast, outbound capacity tightened, as carriers avoided the area. That pushed rates up by 7% even though outbound load volumes dropped 10% w/w.
National average rates provided by DAT iQ.
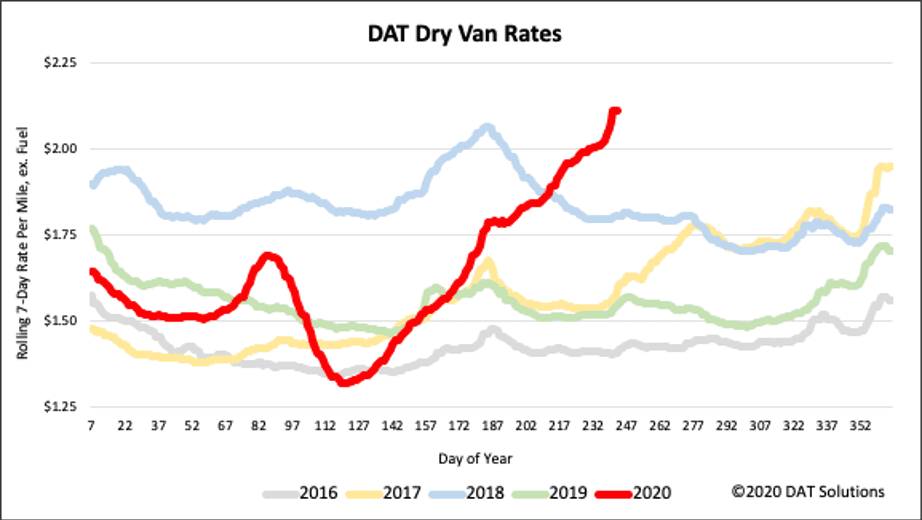
We expect more volatility in the spot market this week, especially as hurricane season reaches its peak. Just last week, the seven-day rolling average for dry van rates spiked 23 cents per mile heading into Gulf Coast markets. We expect similar rate and volume volatility on the outbound side, as shippers get back to work this week.
National van rates ended last week at $2.11/mile (excluding fuel), which is 4 cents higher than the highest weekly rate recorded in 2018 – the high-water mark for dry van spot rates over the last four years.

Forecasting during this volatile period is difficult. Our team is working diligently to update and adjust the models, but new information becomes available at a rapid pace. DAT would typically not publish these types of preliminary studies, but we feel that the benefit of sharing our observations far outweighs the risk. We ask that you please treat these statements and exhibits as directional and consider them as a variable in your own analyses.
How to interpret the rate forecast
- Ratecast Prediction: DAT’s core forecasting model
- Short Term Scenario: Formerly the pessimistic model that focuses on a more near-term historical dataset.
- Blended Scenario: More heavily weighted towards the longer-term models.
- Blended Scenario v2: More heavily weighted towards the shorter-term models.
> Learn more about rate forecasts from DAT iQ
Reefer trends

The late summer/early fall apple season is underway, with carriers busy moving crops from orchards into packing houses for shipment to retail and export markets. According to the USDA, there are 32 states that produce apples commercially, with Washington, New York, Michigan, Pennsylvania and California in the top five. Outbound load volumes in these states are up around 12% w/w and 20% m/m. Nearly all of the Midwest apple crop comes from Michigan, where outbound loads are up 17% w/w as early season apples begin making their way to market.
On the Gulf Coast, Hurricane Laura had a more pronounced effect on inbound reefer volumes, which jumped by 40% w/w into New Orleans. In contrast. outbound reefer volumes dropped by 16% w/w.
On the West Coast in the Stockton, CA market – home to the San Joaquin Valley produce region – outbound reefer volumes increased by 7% w/w. Shippers and brokers found sufficient capacity, though, forcing rates down by 1% w/w to $2.88/mile.

National average rates provided by DAT iQ.
National average reefer rates are now at their highest level in the last five years for the start of September, increasing by 3% w/w to reach $2.28/mile last week (excluding fuel). Reefer rates are now 43 cents higher than this time last year.

Forecasting during this volatile period is difficult. Our team is working diligently to update and adjust the models, but new information becomes available at a rapid pace. DAT would typically not publish these types of preliminary studies, but we feel that the benefit of sharing our observations far outweighs the risk. We ask that you please treat these statements and exhibits as directional and consider them as a variable in your own analyses.
How to interpret the rate forecast
- Ratecast Prediction: DAT’s core forecasting model
- Short Term Scenario: Formerly the pessimistic model that focuses on a more near-term historical dataset.
- Blended Scenario: More heavily weighted towards the longer-term models.
- Blended Scenario v2: More heavily weighted towards the shorter-term models.
> Learn more about rate forecasts from DAT iQ
Flatbed trends

Alabama is number one state for flatbed freight on the DAT One network and is a top 10 lumber-producing state. Outbound load volumes increased by 12% w/w in the Decatur market last week, with 21% of loads destined for regional markets like Knoxville, TN; Lexington, KY, and Atlanta.
In the upper Midwest, outbound volumes continue to climb in the Cleveland market, which has recorded a 18% w/w and 46% m/m increase. Available capacity is also tight, with spot rates up 2% w/w to $2.57/mile – 47 cents higher than the national flatbed average.

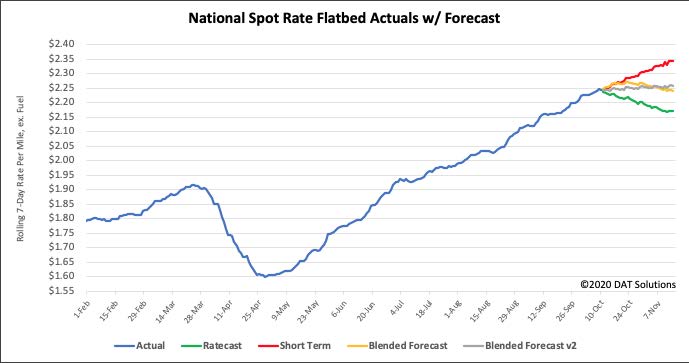
Flatbed spot rates moved up again last week increasing by 2% w/w to $2.10/mile – up $0.05/mile from the week prior. Flatbed rates are now 12% higher y/y and rapidly approaching 2018 levels and considerably higher ($0.16/mile) than 2017 when flatbed capacity was very tight. Over the next four weeks our Ratecast model expects rates to plateau in the $2.00/mile to $2.06/mile band but with Hurricane Laura making landfall this week, we could see a repeat of 2017 when demand for flatbeds during the rebuilding effort (following Hurricanes Harvey and Irma) increased along with spot rates.
Forecasting during this volatile period is difficult. Our team is working diligently to update and adjust the models, but new information becomes available at a rapid pace. DAT would typically not publish these types of preliminary studies, but we feel that the benefit of sharing our observations far outweighs the risk. We ask that you please treat these statements and exhibits as directional and consider them as a variable in your own analyses.
How to interpret the rate forecast
- Ratecast Prediction: DAT’s core forecasting model
- Short Term Scenario: Formerly the pessimistic model that focuses on a more near-term historical dataset.
- Blended Scenario: More heavily weighted towards the longer-term models.
- Blended Scenario v2: More heavily weighted towards the shorter-term models.
> Learn more about rate forecasts from DAT iQ
Need more information?
Our update will be refreshed next week, or sooner if conditions change materially. We recommend that readers visit DAT.com/blog for the latest information. Any questions on this report or market conditions can be emailed to askIQ@dat.com.
We are also making available, free of charge, the DAT Daily 50 which is a daily report of the top 50 lanes by volume with a week’s worth of history and predictions using the Ratecast model.


