The coronavirus continues to drive the direction of the freight economy, and although the COVID Tracking Project reports that new cases and hospitalizations have plateaued nationally, results vary greatly by region.
The percentage of positive COVID-19 tests remains low in the Northeast (1.9%), with declining rates in the South declining rates in the South (11.7%) and West (8.6%). The Midwest is at 5.7% but trending upward.
These varied results have caused disruptions to carrier networks, as areas most affected by the virus continue to have higher consumption (inbound freight) and lower production (outbound freight), leading to more freight imbalances. And while volumes are down now, more freight that would normally move by contract carriers has moved to the spot market due to the disruptions. Shifting consumer demand also creates uncertainty at the lane level as well, with volumes for some commodities surging while others plummet.
The supply side is equally impacted, as manufacturers adapt to new workplace safety requirements. Bloomberg reported that Whirlpool customers were now waiting longer for their dishwashers. CEO Jim Peters reported deliveries that usually take up to two weeks are now out to six months as a direct result of the pandemic. The main reason for the delay is because the company has spaced factory employees farther apart to prevent spread of the virus, but in the process slowed down production lines and reduced capacity.
This is just one of many examples currently impacting supply chains, warehouse capacity and truckload volumes, but what’s clear is it’s going to take some time for the market to stabilize and get anywhere close to normal. The path to economic recovery in the freight market seems inextricably linked to controlling and treating the coronavirus, with the Northeast continuing to provide the best model for what that recovery can look like.
Looking at time and attendance data provided by Homebase, we can see that around mid-June – when virus outbreaks surged in California, Florida and Texas – hours worked, employees working and businesses open all declined. In contrast, the same metrics in New York over the same timeframe improved. While they are nowhere near back to normal, the data shows that where the virus is being contained productivity levels continue to improve.
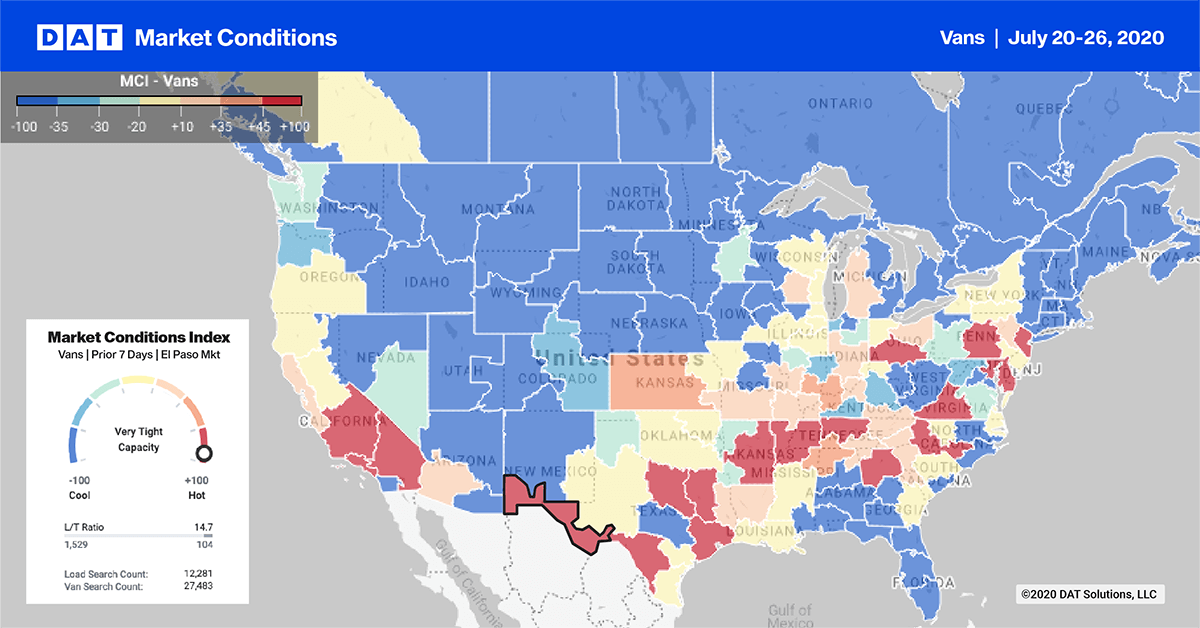
Dry van trends
Market Condition Index (MCI)
Shipments of durable goods, excluding transportation equipment (aircraft), increased again in June by 3.4% month over month, which was almost double the gain from the prior month when shipments increased by 1.9% m/m. Shipment levels were only down 3.4% year over year at the end of June, which is another positive sign that the manufacturing side of the economy is improving.
Last week’s Purchasing Managers’ Index (PMI) published by IHS Markit signaled the first improvement in operating conditions since February. The IHS Markit report also noted that firms saw a rise in new orders for the first time in five months, as customers gradually returned to work.
This week’s Market Condition Index (MCI) shows tighter capacity, putting upward pressure on spot rates in larger freight markets, including Harrisburg, PA (up 2% w/w), Memphis (1.5%), Houston (4%), Laredo, TX (1.5%), El Paso, TX (8%), and Ontario, CA (2%).
The Ontario market is one of the largest in the country and a bellwether for the national freight market given its proximity to the ports in Los Angeles and its ideal location as a multimodal warehouse and freight hub. Following the surge in imports in June, spot market loads out of Ontario are up 4% w/w, increasing for the fourth week in a row with most loads destined for warehouse markets like Phoenix, Dallas and Stockton, CA. The latter also recorded an 11% increase in outbound and is now up 26% m/m.
> Learn more about the Market Conditions Index
Load-to-truck ratio
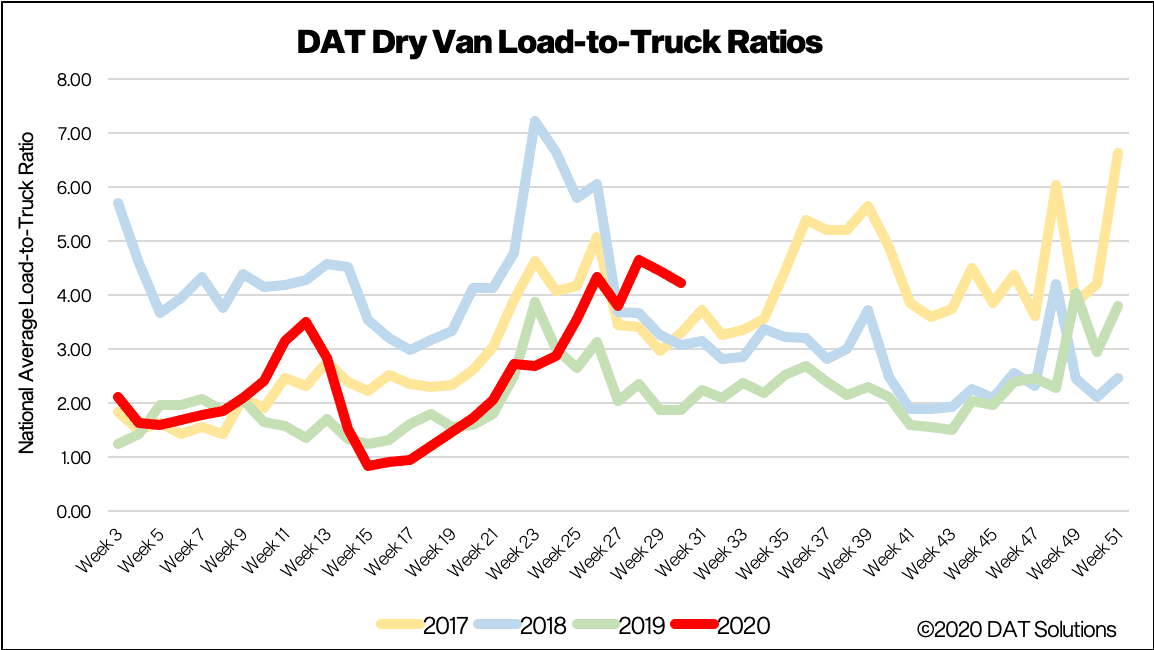
Last week’s load-to-truck ratio (LTR) continues to slide, dropping 5% w/w to 4.23. Dry van load posts also dropped 4%, with truck posts up 2%. Trucks searching for loads are also up 6% m/m, which points to capacity increasing.
Data from telematics giant Geotab, who capture the number of daily commercial truck trips in the U.S., report that daily trips are down 10% as of July 24 compared to the February 2020 pre-COVID19 baseline period. Interestingly, daily truck trips peaked last week, reaching the February baseline level for the first time since the pandemic took full effect.
> Learn more about the DAT One load board network
Spot van rates
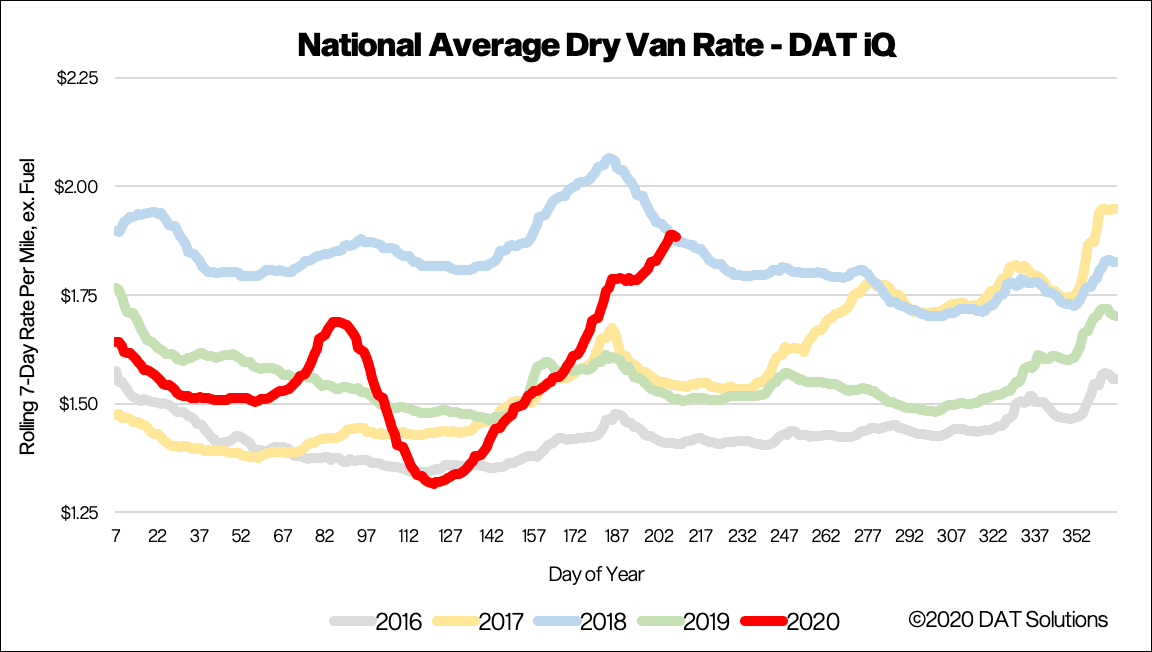
National average dry van spot rates continued to climb again last week, reaching $1.88/mile (excluding fuel surcharges), up 5 cents from the previous week and reaching the same level as the same week in 2018 when capacity was much tighter. Even though 4% more trucks were searching for loads last week compared to the same week in 2018, this year load posts are around 30% higher as a result of shippers utilizing the spot market more due to pandemic-related disruptions to carrier networks.
Our Ratecast model expects dry van rates to plateau from now through the end of August at around the $1.90/mile level, although there is still some upward pressure evident on spot rates as carriers struggle to manage freight imbalances, demand surges for certain commodities and overall supply chain dislocation.
> Learn more about freight rate tools from DAT iQ
Spot rate forecasts
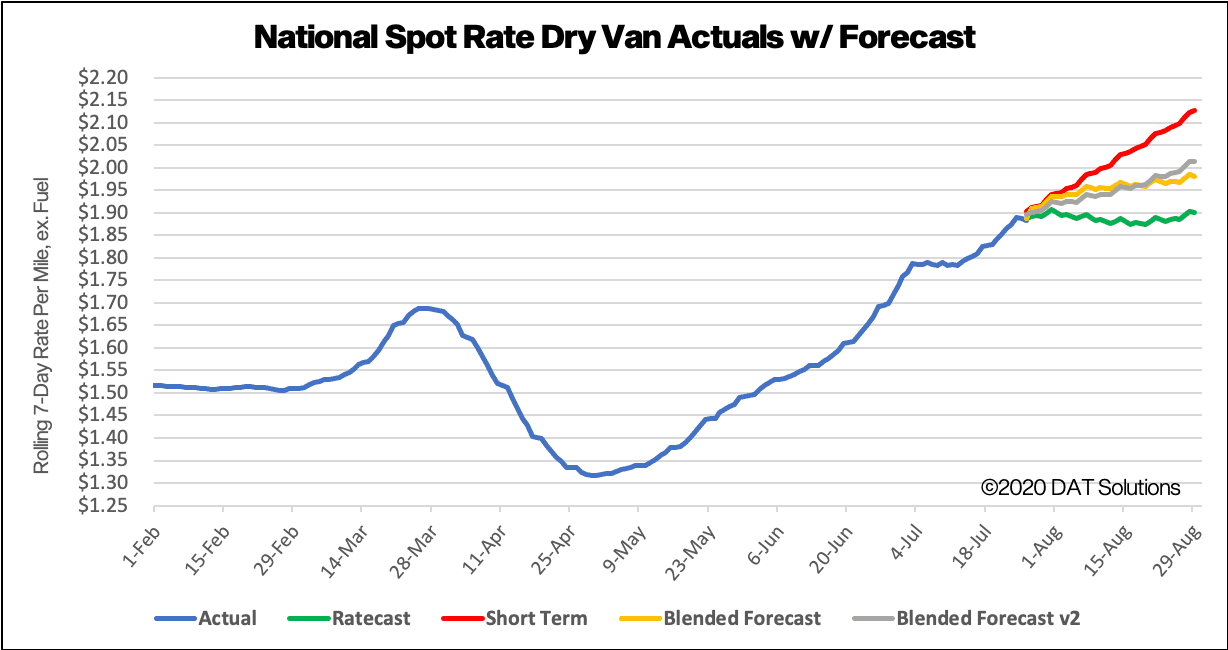
Forecasting during this volatile period is difficult. Our team is working diligently to update and adjust the models, but new information becomes available at a rapid pace. DAT would typically not publish these types of preliminary studies, but we feel that the benefit of sharing our observations far outweighs the risk. We ask that you please treat these statements and exhibits as directional and consider them as a variable in your own analyses.
How to interpret the rate forecast
- Ratecast Prediction: DAT’s core forecasting model
- Short Term Scenario: Formerly the pessimistic model that focuses on a more near-term historical dataset.
- Blended Scenario: More heavily weighted towards the longer-term models.
- Blended Scenario v2: More heavily weighted towards the shorter-term models.
> Learn more about rate forecasts from DAT iQ
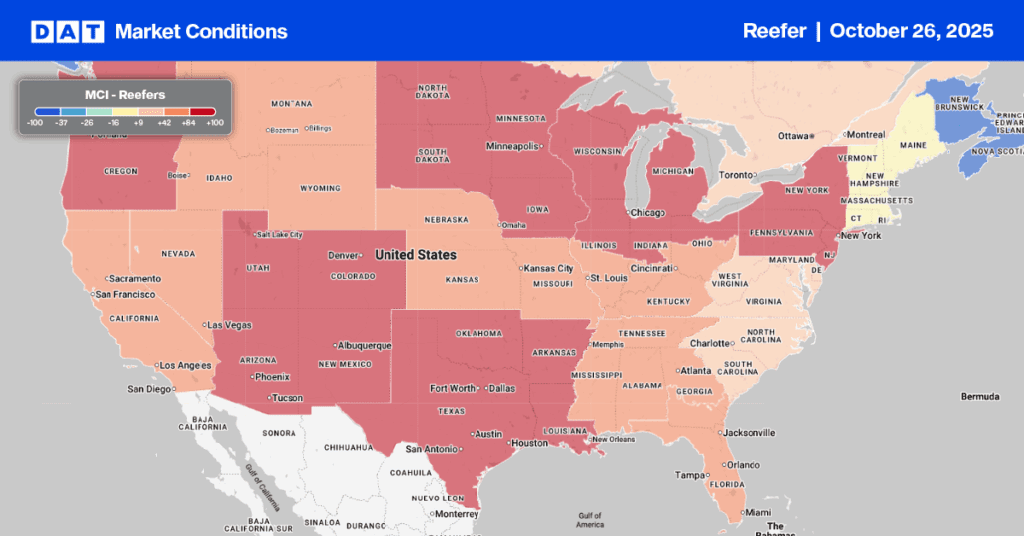
Reefer trends
Market Condition Index (MCI)
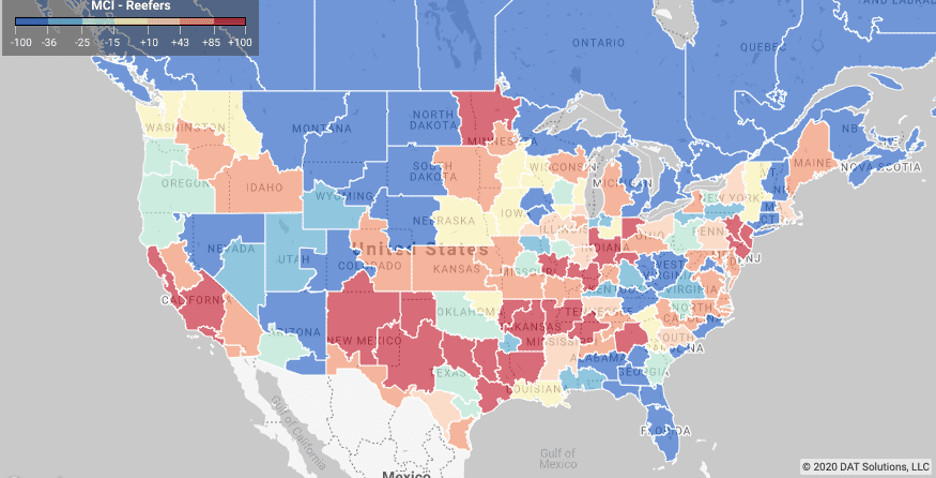
This week’s USDA produce shipment report shows that seasonal year-over-year volumes of produce are down 6% for domestic and 26% for imported truckload shipments, which is just over 6,200 fewer loads of produce compared to the same week in 2019. A shortage of trucks was reported for melons from Maryland, Delaware and Eastern Shore Virginia, Southwest Indiana, Southeast Illinois, North and South Carolina and Southeast Missouri. A slight shortage of trucks was reported for onions from Southern New Mexico; watermelons and onions from the Lower Rio Grande Valley in Texas; and limes, mangos, tomatoes, broccoli, mixed fruits and vegetables from Mexico border crossings in Texas.
East coast import markets, including Philadelphia and Elizabeth, NJ, continued with higher week-over-week volumes, up a combined 6.42% w/w and 29% m/m as southern hemisphere produce volumes continue to arrive by sea. Harrisburg, PA; Atlanta, Boston, Lakeland, FL, and Miami were the top five destinations.
Reefer spot rates out of both markets were strongest in the 300-mile length of haul range, with rates in the $3 to $3.50/mile range (reflecting round trip rates in some cases). Overall, spot rates were flat last week, averaging $1.61/mile and much lower for West Coast carriers looking for backhaul freight.
> Learn more about the Market Conditions Index
Load to truck ratio
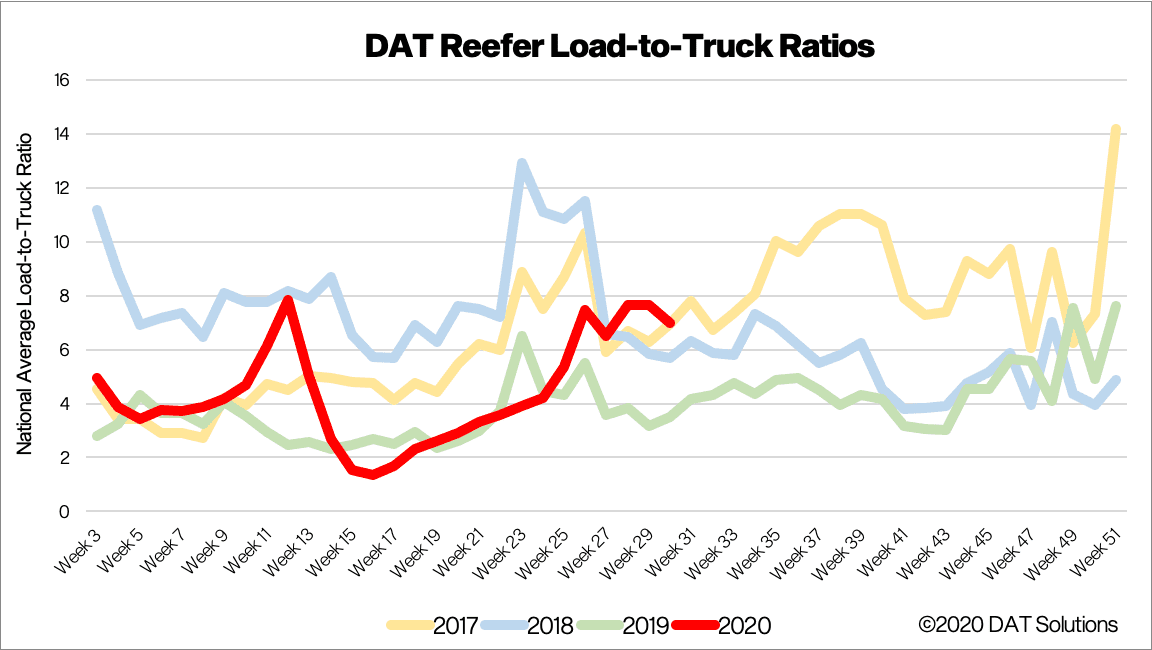
After remaining flat for the previous four weeks, the reefer LTR dropped last week by 8% to 7 loads per truck, which is up 50% compared to last year.
Of note is a further loosening of capacity, as 6% more trucks posted on the DAT One network last week – a trend we’ve been observing for the last four weeks. The number of reefer loads being posted also dropped 3%.
> Learn more about the DAT One load board network
Spot reefer rates
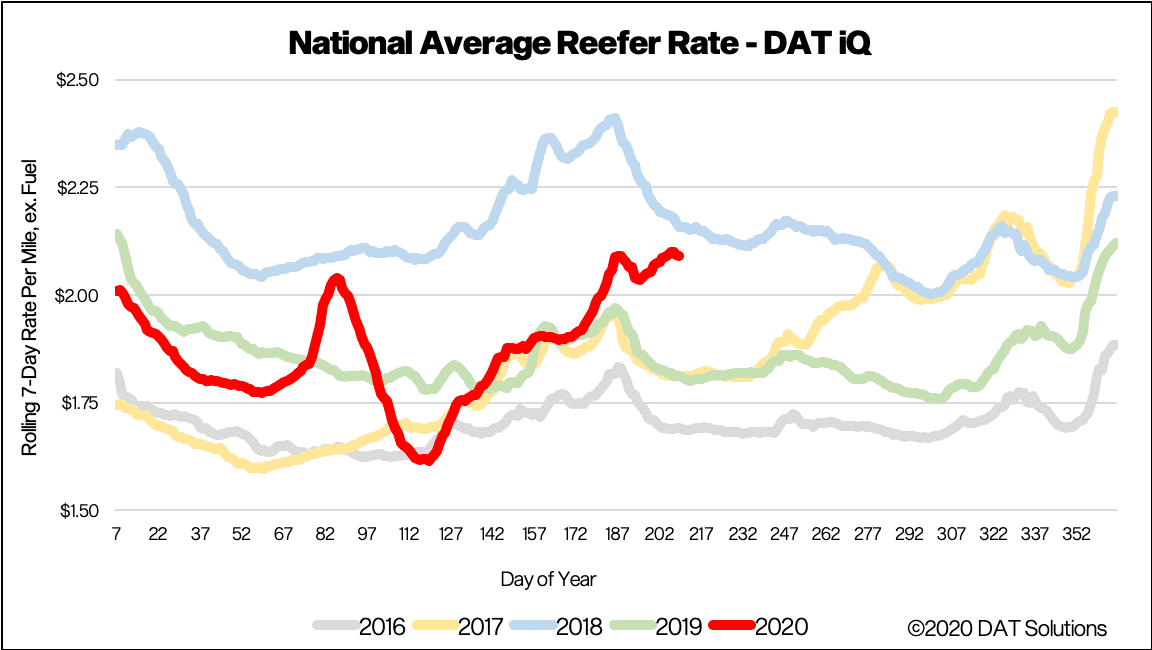
National average reefer rates went against normal seasonal trends by increasing another 4 cents last week to $2.09/mile, which is 13% higher than last year. Record-level temperatures and produce season should keep reefer carriers busy in the short-term, as spot rates sit just 10 cents below this time in 2018 when capacity was extremely tight.
Most indicators point to capacity increasing, which suggests the rise in spot rates is being driven by pandemic-related supply chain disruptions rather than a shortage in available capacity. Our Ratecast model expects reefer rates to plateau from now through mid-August around the current $2.09/mile level.
> Learn more about freight rate tools from DAT iQ
Reefer forecasts
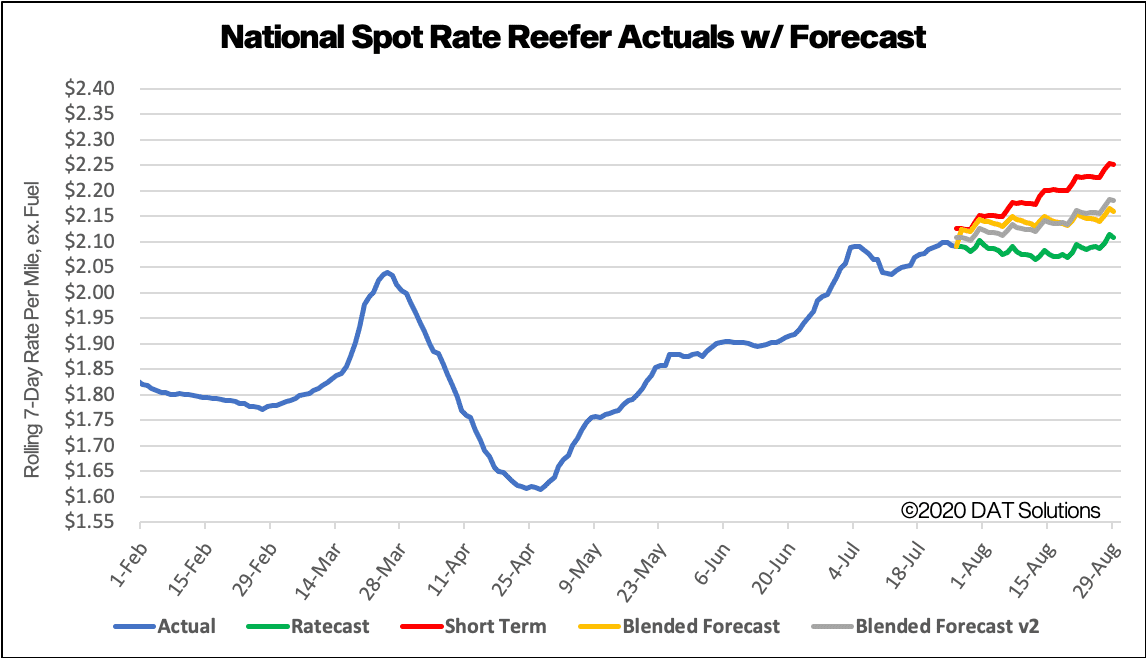
How to interpret the rate forecast
- Ratecast Prediction: DAT’s core forecasting model
- Short Term Scenario: Formerly the pessimistic model that focuses on a more near-term historical dataset.
- Blended Scenario: More heavily weighted towards the longer-term models.
- Blended Scenario v2: More heavily weighted towards the shorter-term models.
> Learn more about rate forecasts from DAT iQ
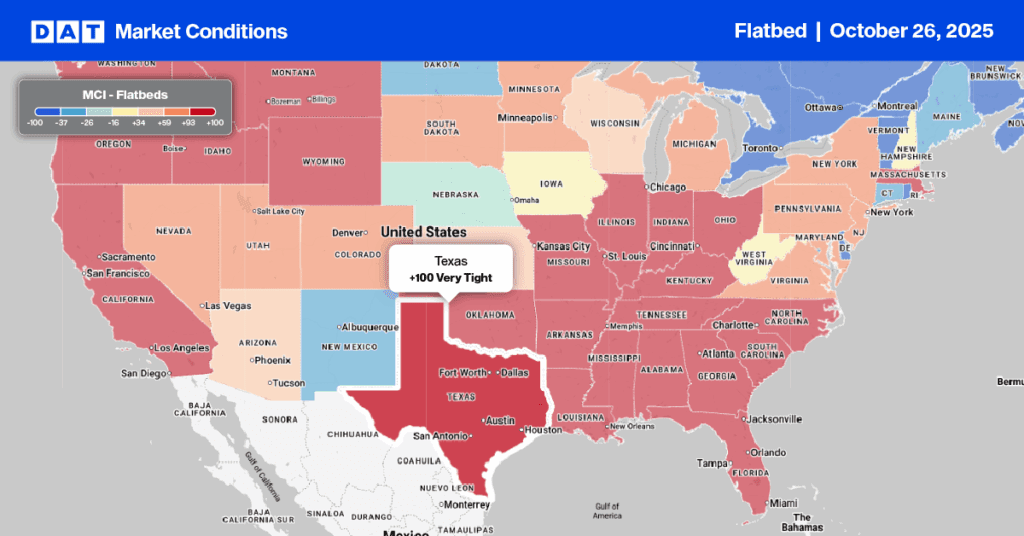
Flatbed trends
Market Condition Index (MCI)
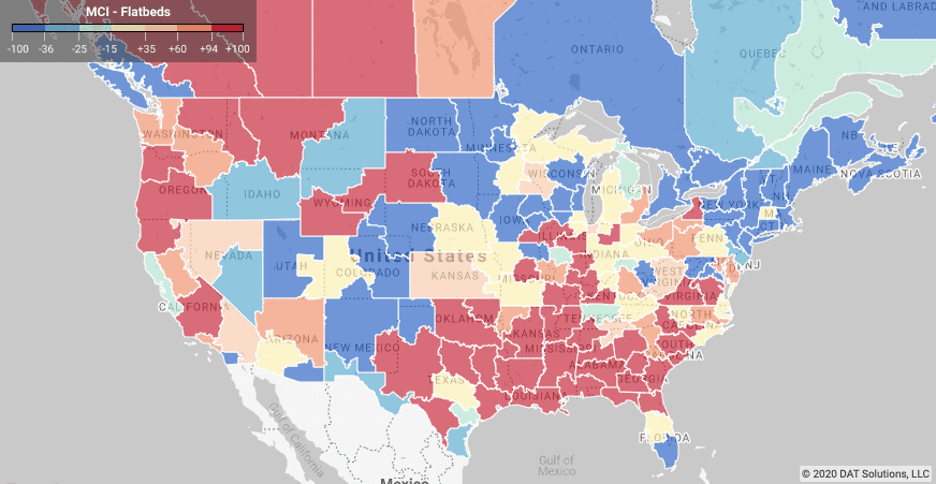
Higher flatbed volumes in the Southeast Region continue to drive demand for flatbeds regionally although national load volumes appear to be plateauing. Higher volumes in Little Rock, AR; Shreveport, LA; Jackson, MS; Mobile, AL; Birmingham, AL, and Decatur, AL contributed to the 10% w/w increase in volumes from this region.
Freight volumes in the Southeast are expected to remain strong based on data from the Dept. of Commerce, which reported new home construction jumped 17% in June but is still down 4% y/y.
Flatbed carriers can expect ongoing demand for standard framing dimension softwood lumber used in new home construction based on reports from lumber pricing specialist Madison’s. They report sawmills are already booked with production orders well into August as producers struggle to keep up with high demand from wholesalers and distributors looking to restock their depleted inventories.
> Learn more about the Market Conditions Index
Load-to-truck ratio
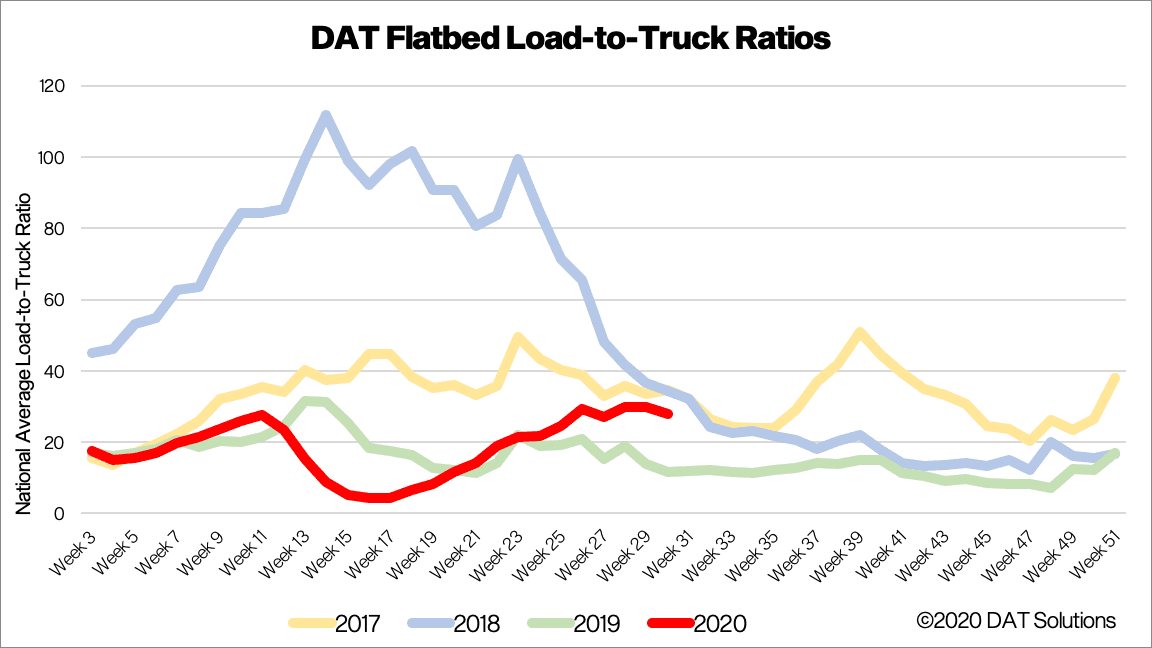
After being flat for the prior two weeks, flatbed load posts dropped 3% w/w and while trucks increased 3%, resulting in a 6% decrease in flatbed LTR. Even though capacity is showing signs of increasing, it is much tighter than the same week in 2019 when 31% more trucks were searching for loads.
> Learn more about the DAT One load board network
Spot flatbed rates
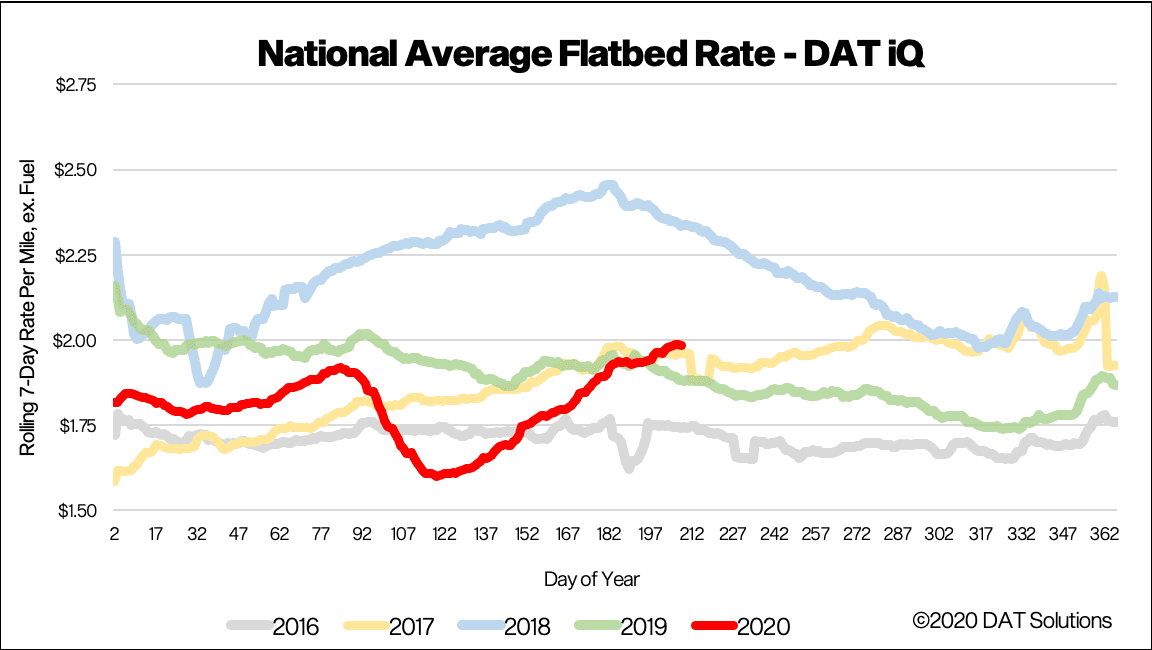
Flatbed spot rates inched higher last week, increasing by just over 2 cents to $1.98/mile excl. FSC. Flatbed rates are now 5% higher y/y, but when compared to the same week in 2018 when capacity was very tight, last week’s rate is around 35 cents lower.
Our Ratecast model expects flatbed rates to decline seasonally to around $1.90/mile and most likely track closely with spot rates in 2017.
> Learn more about freight rate tools from DAT iQ
Spot rate forecasts
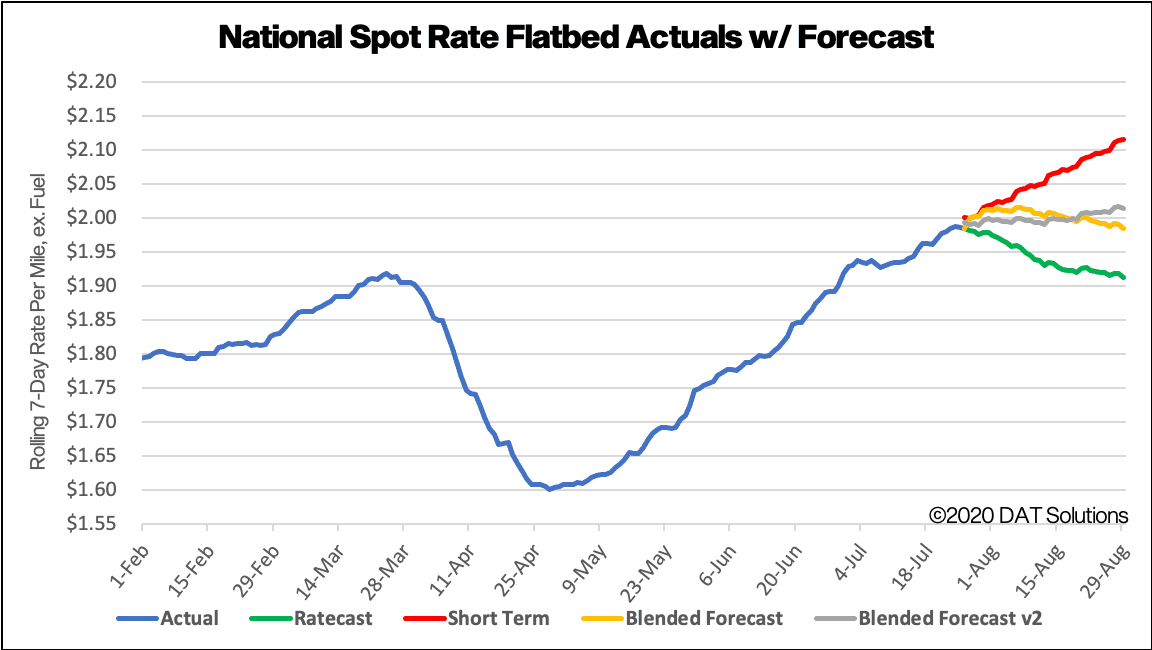
How to interpret the rate forecast
- Ratecast Prediction: DAT’s core forecasting model
- Short Term Scenario: Formerly the pessimistic model that focuses on a more near-term historical dataset.
- Blended Scenario: More heavily weighted towards the longer-term models.
- Blended Scenario v2: More heavily weighted towards the shorter-term models.
> Learn more about rate forecasts from DAT iQ
Need more information?
Our update will be refreshed next week, or sooner if conditions change materially. Any questions on this report or market conditions can be emailed to askIQ@dat.com.
We are also making available, free of charge, the DAT Daily 50 which is a daily report of the top 50 lanes by volume with a week’s worth of history and predictions using the Ratecast model.