In 2005, Congress declared Cinco de Mayo an official US holiday. It has become one of the US’s most significant drinking holidays; however, this day is not a nationally celebrated holiday in Mexico. Cinco de Mayo commemorates the Mexican Army’s victory over the French at the Battle of Puebla on May 5th, 1862, which helped deter the French support of the Confederate army during the civil war. In the ’60s, ’70s, and ’80s, Mexican Americans celebrated the holiday as a way to embrace the Mexican and American connection.
However, the US celebration has grown in popularity primarily due to a marketing strategy by the Corona and Grupo Modelo beer distributors, Gambrinus Group, from San Antonio, TX. The San Antonio-based beer importers launched an ad in 1989 encouraging Mexican Americans to make it a priority to drink Mexican beer on this day, and it was a success. By 1996, Cinco de Mayo had become synonymous with drinking Corona to celebrate the day. Today, Cinco de Mayo often has more significant beer consumption than the Super Bowl or St. Patrick’s Day.
The commercial success of this day by the beer industry has led other countries like Malta, Australia, the Cayman Islands, and Canada to celebrate Cinco de Mayo. In the US, the largest celebrations are in Los Angeles, CA; San Antonio, TX; Denver, CO; Chicago, IL and Chandler, AZ. According to the California Avocado Commission, Cinco de Mayo also creates an increase in sales of Avocados and Tequila. Americans consume up to 81 million pounds of avocados on Cinco de Mayo every year. Americans spend upwards of $2.9 billion on margaritas annually (that’s 14 percent of American cocktail spending), and the United States is the biggest tequila market globally. As for cervezas (Spanish for “beer”), Americans consumed almost a billion liters of Corona Extra in 2014.
According to US Trade Data, Mexican beer Import trends show a sharp increase starting in March and continuing into April. In 2019 (pre-pandemic), Mexican beer imports grew 42% m/m in March and 7% in April. Tequila imports started increasing in February with a 35% m/m increase, and growth continued into March at a 19% m/m increase. Avocados also saw sharp increases in March with a 34% m/m increase and continued into April with a 48% m/m increase.
Loads moved on the top 100 van lanes dropped on 78 lanes last week and increased on just 20, with spot rates down on 71 lanes and up on just 10. Across all markets, loads moved were down 7% last week, which is unusual for the last week of the month. Some markets reported increased load board activity, including the Los Angeles and Ontario markets, where load post volumes increased 9% w/w after being flat for most of April. Available capacity continued to loosen, though, as spot rates dropped $0.06/mile to an average outbound rate of $2.25/mile excl. FSC. At the peak of container import activity and port congestion late last year, average outbound Los Angeles spot rates have dropped by $1.12/mile from the November high of $3.37/mile excl. FSC.
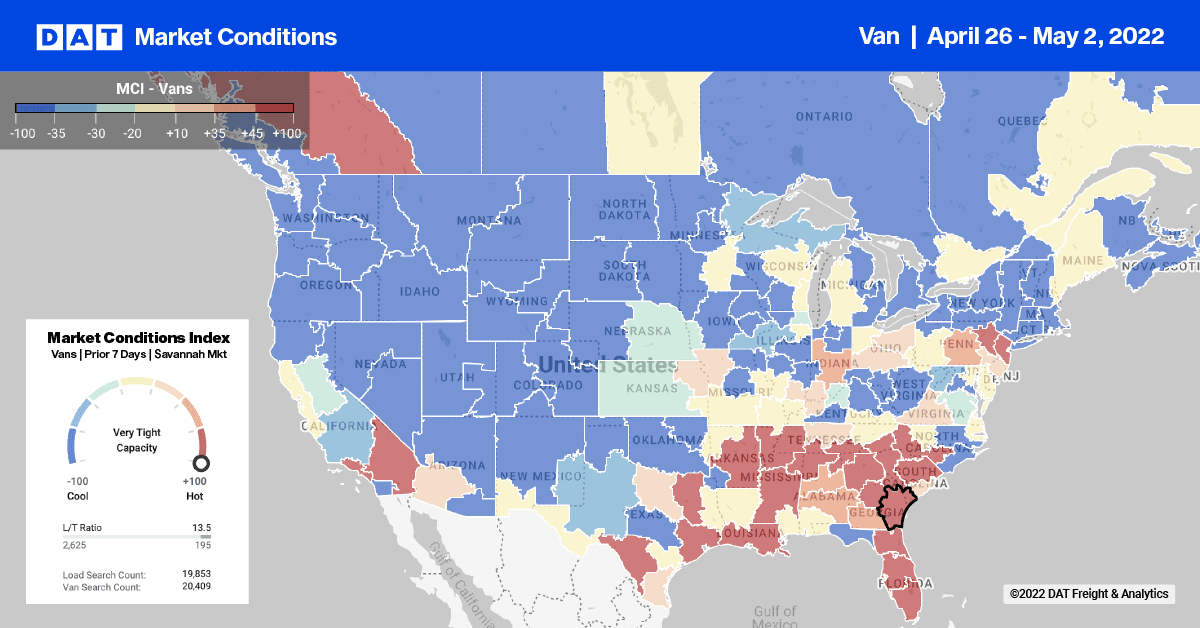
Higher demand for reefers in Miami created a slight shortage of northbound dry van freight capacity, pushing up spot rates by just a penny per mile to an average of $1.16/mile excl. FSC. That wasn’t the case on the busy Atlanta lane, where linehaul rates dropped to just $0.73/mile or $0.39/mile lower than the previous year. On the 1,320-mile haul north to Chicago, rates increased by around $0.10/mile to an average of $1.02/mile excl. FSC is still $0.10/mile lower than the same time last year.
Last week, the dry van capacity tightened for the second week in a row in Wilmington, N.C. Spot rates jumped from $0.09/mile to $2.33/mile excl. FSC. On the 800-mile lane west to Memphis, rates inched higher to $1.89/mile excl. FSC is still down $0.36/mile since the start of the year and $0.29/mile lower than the previous year. Further north in the Brooklyn market, load post volumes jumped 19% last week, pushing up spot rates by $0.08/mile to an average of $2.51/mile excl. FSC. Spot rates on the Atlanta lane increased $0.03/mile last week to $2.25/mile excl. FSC, which is $0.23/mile higher than the previous year.
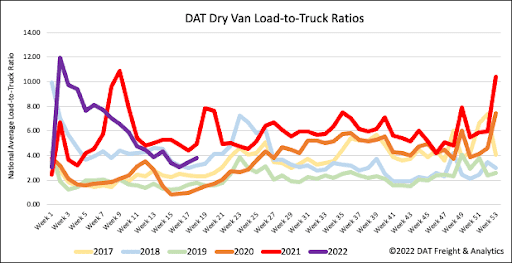
End-of-month shipping volumes boosted spot market activity last week, pushing up load post volumes by 4% w/w. Volumes are still down 17% y/y and 11% m/m but tracking closely with 2018 levels. Equipment posts decreased 4% w/w, resulting in the dry van load-to-truck ratio increasing 9% w/w from 3.47 to 3.78.
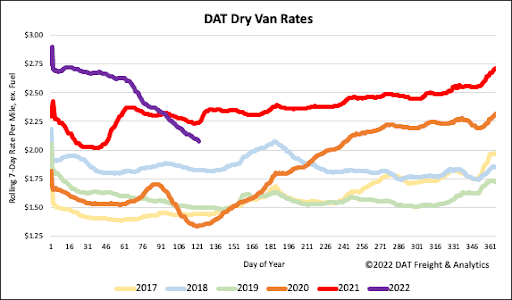
Dry van spot rates dropped another $0.05/mile last week to a national average of $2.11/mile excl. FSC. Compared to the same week the previous year, dry van spot rates are now 7% or $0.17/mile lower after dropping $0.67/mile since the start of the year. Last week’s national average is still $0.57/mile higher than 2019 and $0.54/mile higher than the average of pre-pandemic years going back to 2016.


