One of the main forces driving disruptions in supply chains and the truckload transportation market that had the most impact throughout January was the rapid spread of the Omicron variant (and various responses to it).
The Omicron variant now makes up 95% of all sequenced COVID cases in the US. While less deadly than the Delta variant from earlier this fall, it is significantly more contagious. This makes the Omicron variant much more disruptive to supply chains than the Delta variant – mainly due to quarantine protocols and widespread testing. Most companies have a policy whereby any positive test result (with symptoms or not) means immediate quarantining of five (and sometimes more) days. For the first two weeks of January, the Census Bureau found that approximately 8.8 million workers reported not working because they were either sick with the coronavirus or caring for someone who was. This is double the number from October! Essentially, Omicron has created a rolling wave of “sick-outs” across all industries and regions.
For truckload carriers and their drivers who spend too much time on understaffed loading docks, the labor disruptions are not permanent removals from the workforce. The Omicron surge also appears to be relatively short-lived with a roughly one-to-two-month duration. Some of the earliest hit regions (e.g., the Northeast) are already declining in cases suggesting some reductions in extended dwell times loading and unloading. Spring is not too far away, and by then, we should begin to see some stabilization in the labor force in warehouses, which should, in turn, speed up the velocity of trucks throughout freight networks.
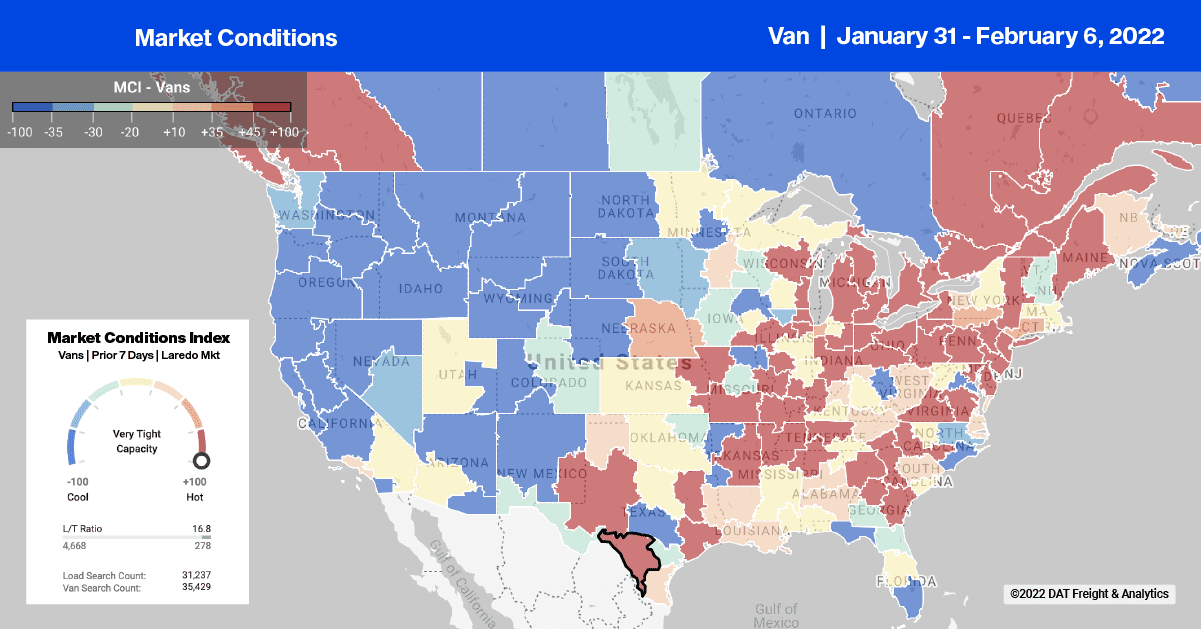
As the Canadian trucker protest moves into its second week, the impact on significant import/export trade lanes continues. Spot rates on “auto alley” between Laredo and Canada continue to climb as capacity tightens due to fewer trucks heading into the U.S. for loads of auto parts back to Canadian auto manufacturers. DAT’s 7-day rolling average spot rate is $2.68/mile excl. FSC this week (Laredo-Montreal), which is double the long-term average rate for all of 2021. Laredo to Quebec City rates are also up about $0.60/mile over the long-term average, while loads to Detroit are up $0.13/mile to an average of $2.29/mile excl. FSC this week. Capacity for loads from Laredo to Toronto was also tight last week – spot rates were up $0.30/mile to an average of $1.98/mile excl. FSC. For context, spot rates on this lane were $1.39/mile excl. FSC this time last year and averaged $1.43/mile excl. FSC for all of 2021, making last week’s spot rate $0.55/mile higher than the previous year.
Dry van capacity was very tight in the lower Midwest market of North Platte, NE, following last week’s 18% w/w increase in load posts. After dropping for the prior three weeks, outbound spot rates jumped $0.19/mile to an average of $2.46/mile excl. FSC last week. Capacity continues to loosen on the West Coast in Los Angeles, where spot rates are down for the fourth week in a row averaging $3.09/mile excl. FSC last week – that’s a drop of $0.33/mile in the previous month.
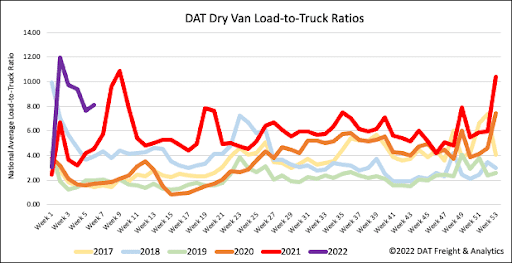
Dry van load post volumes are now down 18% m/m following last week’s 2% w/w decline. Volumes are still 74% higher than the same week last year but appear to be following a more seasonal pattern as we head in February. Carrier equipment posts decreased by the same amount resulting in the dry van load-to-truck ratio increasing by 6% w/w 7.63 to 8.08.
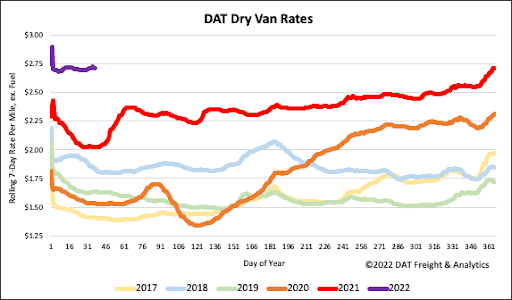
Spot market capacity continues to loosen slowly following last week’s less than $0.01/mile decrease in spot rates. Rates have only decreased by $0.02/mile in the previous month and remain 34% or $0.69/mile higher compared to the same week in 2021. The dry van national average ended the week at $2.72/mile excl. FSC, which is $1.14/mile higher than the week five average for the five years before the 2020 pandemic started.