Since 2014, van and reefer rates have peaked late in the 4th quarter, thanks to the impact of e-commerce freight. Flatbed loads, however, have been relatively untouched by those retail and consumer trends.
Instead, we generally see some spikes for flatbed freight during November, as Christmas trees are harvested and moved to urban areas. This year wasn’t a great one. There were reports of a shortage of trees in some areas and even DAT’s Hot Market Map revealed a relatively quiet season in terms of flatbed demand.
Following the holiday season there have been some interesting spikes. The national average flatbed rate increased by 5¢ from November to December and the month of January has seen an uptick even as van and reefer rates have started to dip seasonally. So what’s up with flatbed?
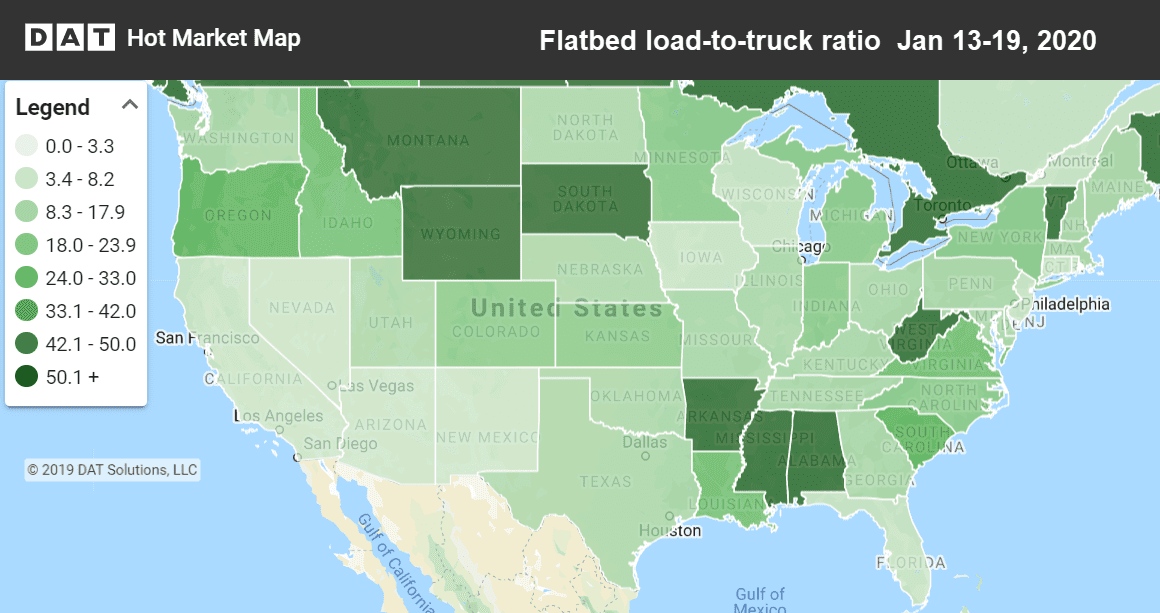
Flatbeds are in high demand in the Upper Rocky Mountain states and certain Southern states, as seen in this Hot Market Map, which is available in the DAT Power load board and DAT RateView.
Oil production increases flatbed demand
A quick look at oil rig counts from the Baker-Hughes report reveals an uptick in U.S. oil rigs in operation in the most recent report. Gains include 3 wells opened in New Mexico and 5 in Texas, and 3 wells added in North Dakota. Overall, the U.S. gained 15 oil rigs, while Canada really jumped, adding 41 active wells. This signals a reversal of 2019 trends of fewer wells in operation. But the really big news is the announcement that TC Energy will proceed with completion of the Keystone XL Pipeline.
The Keystone XL Pipeline connects the tar sands of Alberta, Canada with the lower United States. It’s an $8 billion project that will result in an additional 830,000 barrels of oil to be produced when fully operational. The key states for construction include Montana, Nebraska, and South Dakota — in other words, the Upper Rocky Mountains and Plains states. Press releases reveal that full construction will begin this spring, but supplies and materials have already begun to move.
It just took me a few minutes with DAT RateView to download some regional views of U.S. flatbed rates. This confirmed that rates in the West and Mountain states have been rising. Most of North America is seeing higher flatbed rates, exceptions include origins in the Upper Atlantic and Central Canada.
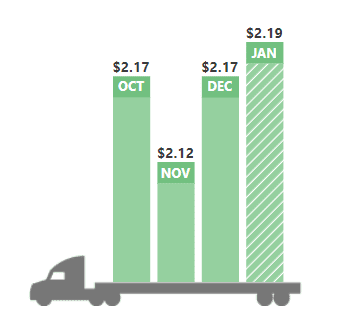
The national average flatbed rate has risen 7¢ since November.
I first noticed this trend of higher rates and demand in RateView and Hot Market Maps, and now it can be confirmed that despite flat pricing for oil in the world markets, major investments will likely drive improved flatbed pricing well into the summer of 2020.
RELATED: Van rates lose traction heading into winter slump
Interested in flatbed trends? Subscribe to DAT’s free Trendlines newsletter. Trendlines includes weekly updates on flatbed capacity and flatbed rates.


