The Baker Hughes Rig Count, which is an important business barometer for the drilling industry and its suppliers, has increased by 60% in the last year to a total of 604 drilling rigs (oil and gas combined). Even though this number is growing steadily, last week’s rig count is still 24% (188 rigs) lower than the total just before the global pandemic was announced. Just under 50% of all rigs are located in the Permian Basin (DAT Lubbock freight market) in West Texas, and even though the pace of growth in drilling in this region is lower than the national average, DAT is still seeing strong demand for flatbed carriers in the Houston market (for drill pipe, casing, machinery etc.).
Another indicator of flatbed demand is the mileage of pipeline being used in the construction of gas pipelines.According to the Energy Information Administration (EIA) there is currently 642-miles of new pipeline due for completion this year. Assuming there are 130-tons of steel per pipeline-mile and 30 tons per flatbed load, flatbed carriers can expect to haul just over 2,700 truckloads of gas pipeline this year, slightly less than 2021’s volume. However, the volume of flatbed loads in 2022 more than triples for when pipeline construction with a 2023 completion is factored in with the majority of construction.
Flatbed loads moved on DAT’s number one flatbed lane between Houston and Ft. Worth increased 9% w/w making it four successive weeks of gains although capacity continues to ease. Spot rates are currently averaging $2.78/mile excl. FSC, which is $0.42/mile lower m/m but still $0.64/mile higher than this time last year.
Another popular flatbed lane is Houston to Lubbock in the Permian Basin oilfield – spot rates have been flat around $2.90/mile excl. FSC for the last three months although they are still $0.73/mile higher y/y. Loads north to Oklahoma City are also steady averaging $2.71/mile excl. FSC this week (up $0.67/mile y/y) while spot rates north to Bismarck, ND home to the Bakken oilfield, are averaging $3.02/mile excl. FSC this week, which is $1.17/mile higher than this time last year.
Load-to-Truck Ratio (LTR)
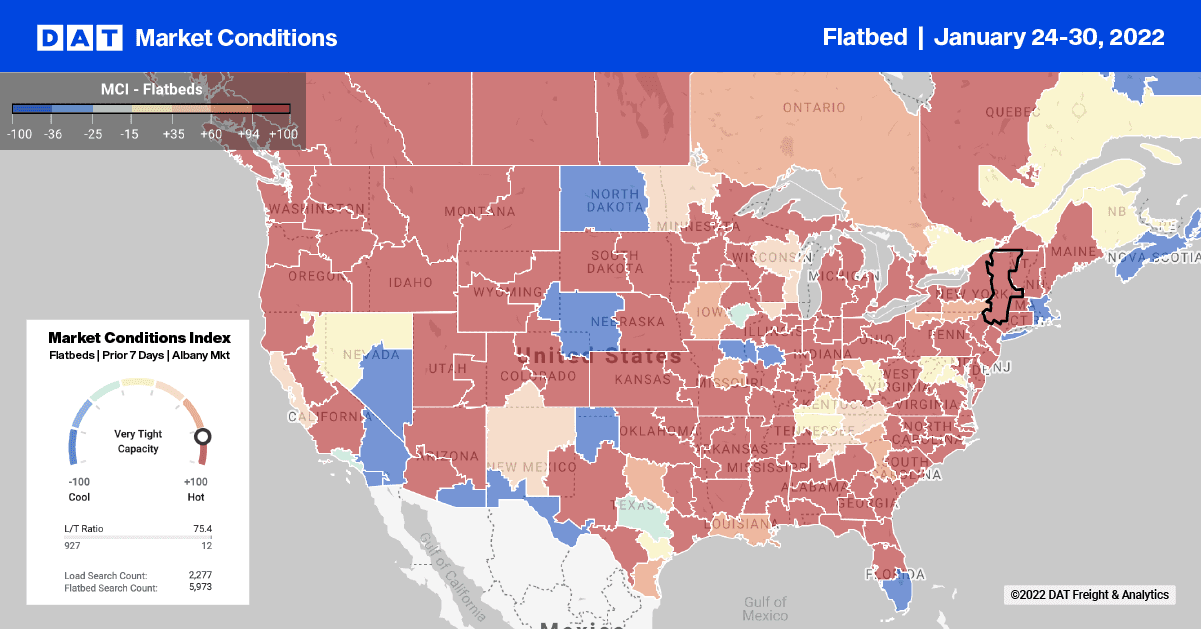
Winter is often the hardest time of the year for flatbed carriers, shippers and brokers, as equipment freezes and winter weather extremes make it much harder to work outdoors. As a result, it’s no surprise to see flatbed capacity continues to decrease in the spot market following last week’s 1% w/w increase in load posts making it four straight weeks of gains. Carrier equipment posts were up 8% w/w resulting in last week’s flatbed load-to-truck ratio decreasing 8% w/w from 92.05 to 84.91.
Spot Rates
Flatbed spot rates have been flat for all of January averaging $2.66/mile excl. FSC. As they did most of last year, flatbed spot rates have been moving up and down by a penny per mile each week following last week’s increase of $0.01/mile ending the week right at the monthly average. The national average is currently $0.46/mile higher compared to the same period last year and $0.67/mile higher than the same week in 2018.