Often we look at building permit applications and new home starts as indicators of flatbed demand. Sales of new homes are another measure of demand for products, including building material and lumber.
The difference with the home sales category is the new home can be in any stage of construction: not yet started, under construction or completed.
The latest report from the U.S. Census Bureau reported sales of newly built, single-family homes in February fell 18.2%, the lowest level since last May of last year. Reasons for the drop include higher interest rates, supply shortages and rising material prices, particularly for lumber.
Within the broad category of new home sales is the number sold before construction starts, which is up 17% y/y (although February’s numbers reported a decrease of 5% m/m).
“Though buyer traffic remains strong,” according to Chuck Fowke, chairman of the National Association of Home Builders, “some home building activity is being delayed due to material shortages, forcing builders and buyers to grapple with rising affordability issues, as soaring lumber prices have added more than $24,000 to the price of a new home.”
The general consensus is that new home demand is strong despite the delays on the construction and materials side.
Find flatbed loads and trucks on the largest load board network in North America.
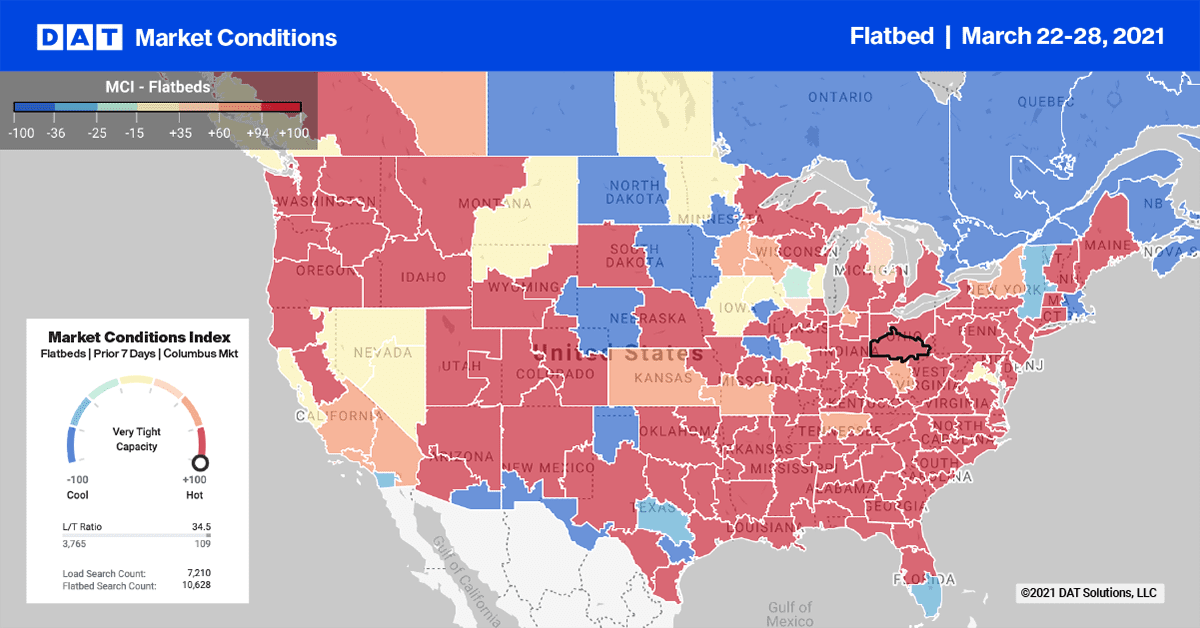
Load posts in the top 10 flatbed markets moved up slightly last week, increasing by just 1%. Capacity eased slightly, with average outbound rates to all markets decreasing by $0.01/mile to $2.91/mile.
In the Mid-South Region, including Little Rock, AR; Memphis; Decatur, AL; Montgomery, AL; Birmingham, AL, and Jackson, MS, markets, outbound volumes dropped 25% on average. Outbound rates dropped $0.08/mile to an average $2.91/mile.
In the Pacific Northwest, capacity was very tight in Medford, OR, following a 13% w/w decrease in volume. Rates jumped $0.49/mile to an average of $2.76/mile. Around 8% of outbound loads from Medford are destined for the Spokane, WA, market where capacity has tightened. Spot rates are up $0.34/mile since February to an average of $2.68/mile, excluding fuel.
Spot rates forecasts
The national average flatbed rate increased again last week, making it the eighth straight week of gains. The average spot rate increased $0.03/mile to $2.43/mile, excluding fuel, $0.48/mile higher than the same week in 2020. Compared to 2018, flatbed rates are now $0.20/mile higher.
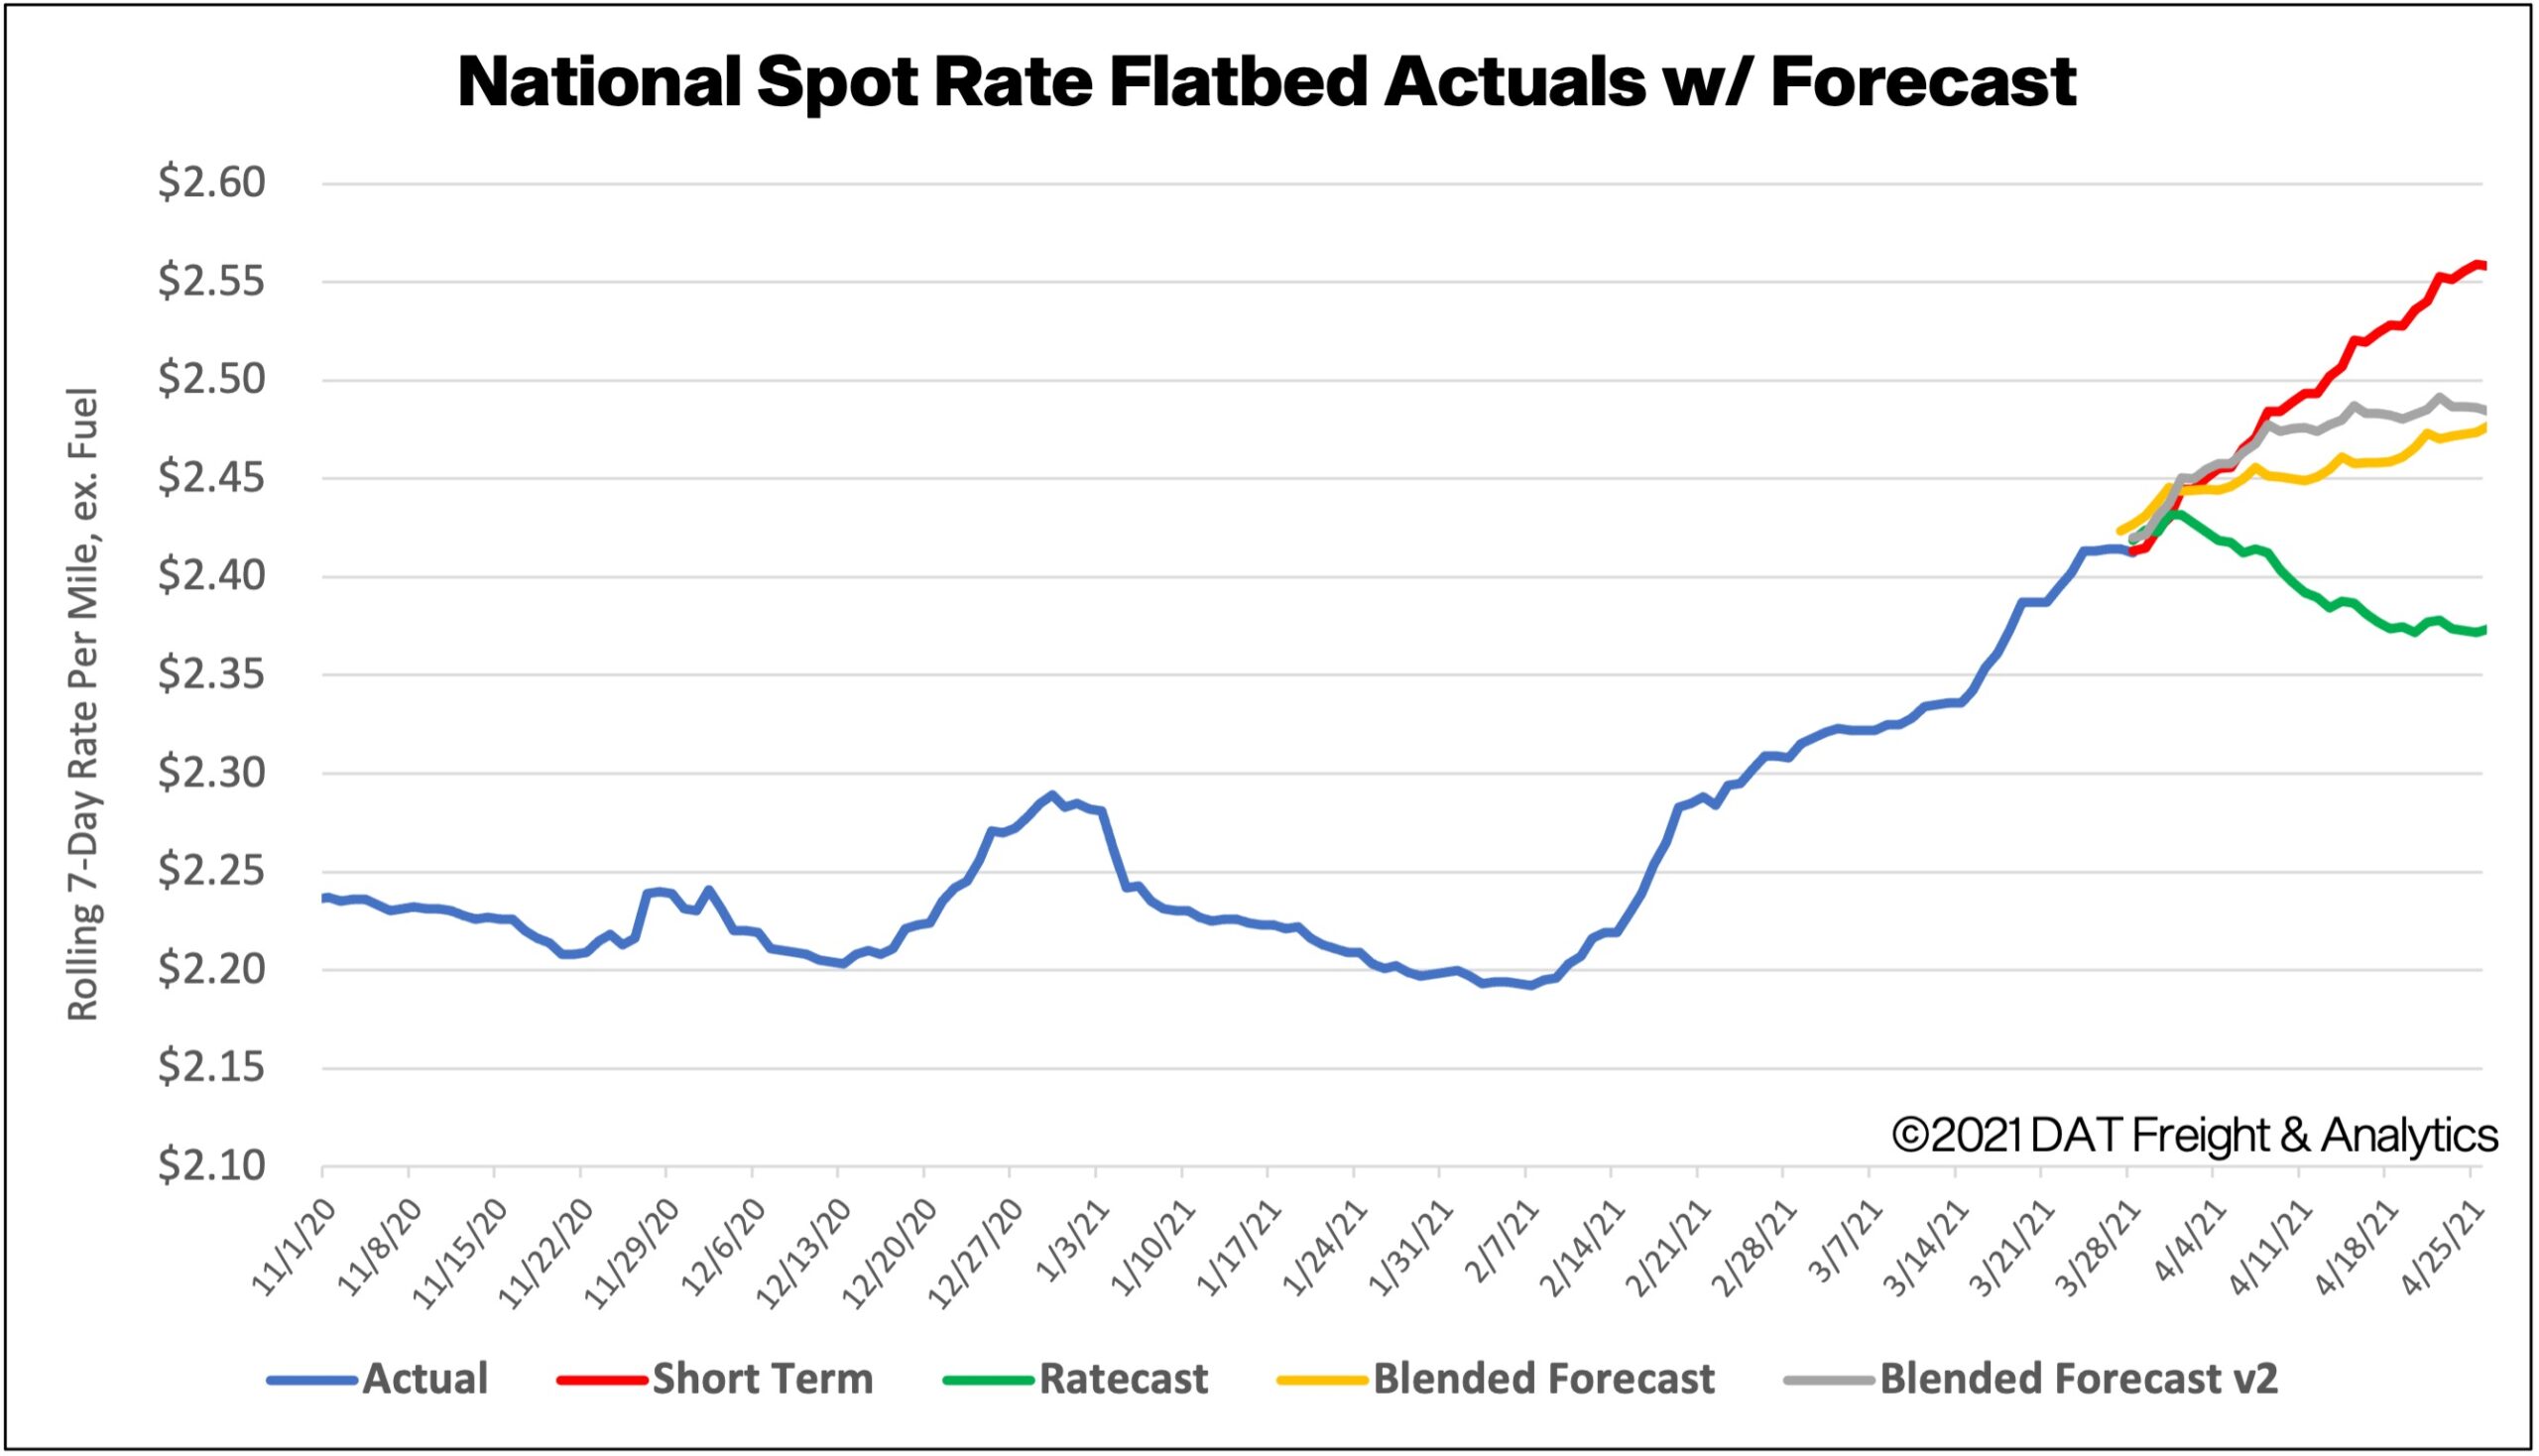
How to interpret the rate forecast:
- Ratecast: DAT’s core forecasting model
- Short Term Scenario: Formerly the pessimistic model that focuses on a more near-term historical dataset.
- Blended Scenario: More heavily weighted towards the longer-term models.
- Blended Scenario v2: More heavily weighted towards the shorter-term models.