This week there are global fears the COVID-19 virus is making a resurgence, especially in southern hemisphere countries, which are in the middle of their winters where people spend more time indoors in close proximity to each other. According to data from the COVID Tracking Project, almost twice as many countries have reported a significant rise in new cases over the past two weeks compared to those countries reporting declines.
Earlier this week the White House coronavirus task force warned the pandemic is “extraordinarily widespread” in the US, which continues to play out in the dislocation of freight markets as some counties and regions reopen successfully while others either slow down or cease reopening plans.
Consumer confidence has already taken a hit, based on the latest Conference Board Consumer Confidence Index, which decreased in July. Consumer spending makes up close to 70% of the U.S. economy, so the recovery will depend heavily on how consumers feel about the economy and their financial prospects. The Conference Board’s Expectation Index is probably more indicative of what lies ahead – July’s numbers showed a notable decrease from 106.1 in June to 91.5 in July, pointing to consumers becoming less optimistic about the short-term outlook for the economy and labor market.
As consumers increasingly shift to online purchases, DAT has seen load volumes into the top ten on-demand fulfillment warehouse markets increase by 2.44% week over week and 25% month over month, following the surge of imports for stay-at-home goods. Leading the way were the major Midwest warehousing hubs of Joliet and Indianapolis, which both reported a 3% w/w and 10% m/m increase in inbound loads.
All eyes are on Congress this week – the outcome will have a significant impact on consumer confidence and retail inventories that have been building in anticipation of a continued economic recovery.
Dry van trends
Market Condition Index (MCI)
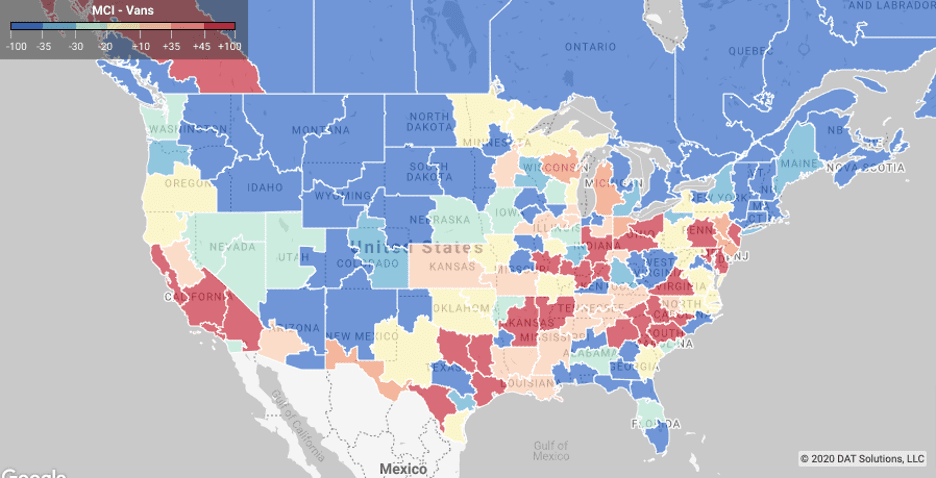
After weeks of uncertainty caused by the pandemic, East Coast freight markets were thrown into more turmoil with Tropical Storm Isaias. As the fast-moving storm moved north, it caused tornadoes, fires, storm surge, flooding and widespread power outages along the entire I-95 freight corridor. Late last week as the storm approached Florida, shippers moved more freight off their docks than normal for a typical month-end. In the Lakeland market, load volumes jumped 20% last week after decreasing for the prior four weeks.
Freight brokers reported increased load board activity as early as last Tuesday, driven largely by demand for emergency supplies, water and food, which continued to ramp up throughout the week and into the weekend.
> Learn more about the Market Conditions Index
Load-to-truck ratio
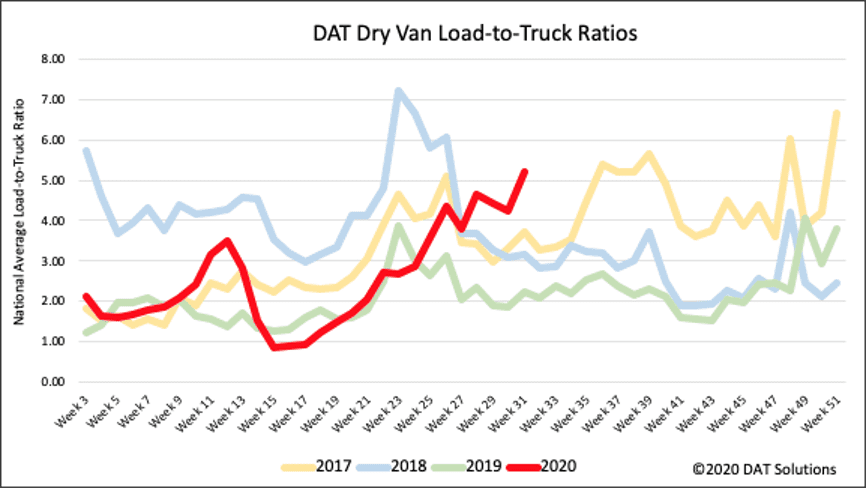
Last week’s load-to-truck ratio (LTR) reversed course and increased by 23% w/w to 5.22 – the highest dry van reading seen in the last four years for the start of August. Dry van load postings also increased by 14% to 1.2 million loads, which is just over double the volume of loads this time last year. Capacity showed signs of tightening with 8% fewer trucks searching for loads.
> Learn more about the DAT One load board network
Spot van rates
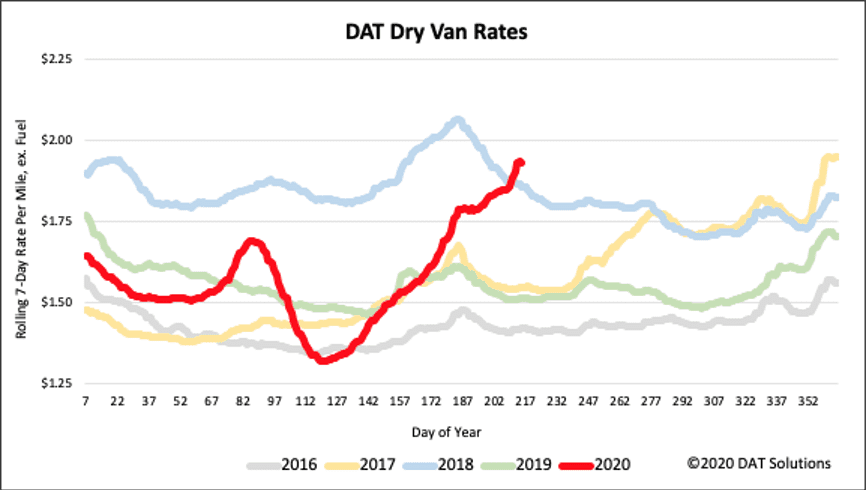
As freight market volumes remain inconsistent at the commodity level and carrier networks remain out of balance, spot rates continue to climb as shippers sought surge capacity on the spot market. National average dry van spot rates jumped 8 cents to $1.93/mile (excluding fuel surcharges), which is 42 cents higher than the same week in 2019 and 7 cents higher than 2018.
Our Ratecast model expects dry van rates to stay in the $1.93/mile to $1.95/mile range through early September, which is a reflection of the freight imbalances carriers are experiencing in their networks and volume surges from shippers during the pandemic.
> Learn more about freight rate tools from DAT iQ
Spot rate forecasts
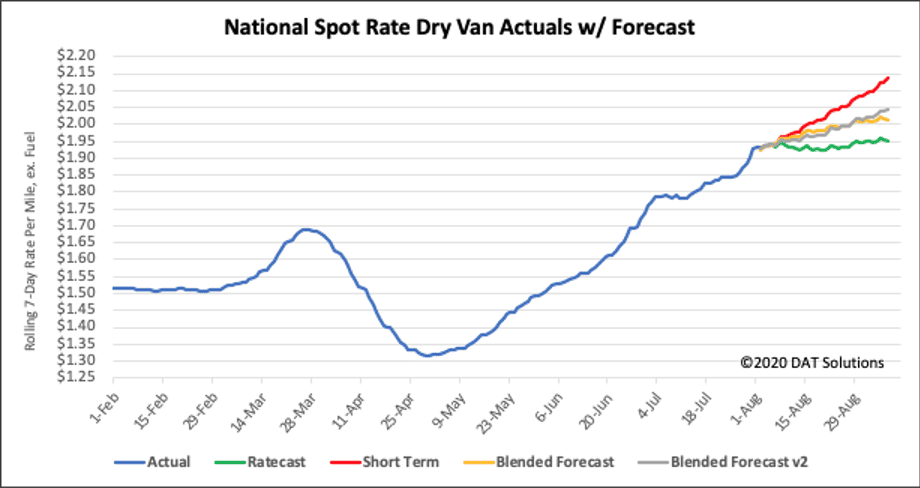
Forecasting during this volatile period is difficult. Our team is working diligently to update and adjust the models, but new information becomes available at a rapid pace. DAT would typically not publish these types of preliminary studies, but we feel that the benefit of sharing our observations far outweighs the risk. We ask that you please treat these statements and exhibits as directional and consider them as a variable in your own analyses.
How to interpret the rate forecast
- Ratecast Prediction: DAT’s core forecasting model
- Short Term Scenario: Formerly the pessimistic model that focuses on a more near-term historical dataset.
- Blended Scenario: More heavily weighted towards the longer-term models.
- Blended Scenario v2: More heavily weighted towards the shorter-term models.
> Learn more about rate forecasts from DAT iQ
Reefer trends
Market Condition Index (MCI)
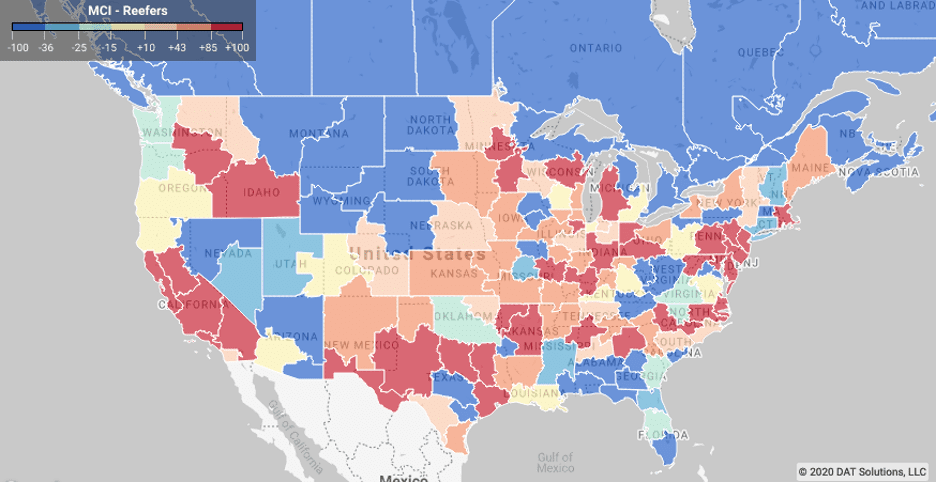
Health conscious consumers have been driving higher demand for immune-boosting leafy greens during the pandemic, but unlike in previous years, retailers are the main consignees. Demand in the hard-hit restaurant and foodservice sector remains low.
On this week’s Market Condition map, capacity has been tighter in all Southern California markets especially in the Salinas Valley where most Iceberg and Romaine lettuce is grown this time of the year. According to the USDA, around 1,800 refrigerated truckloads are being shipped weekly out of the San Francisco freight market with volumes up 6% w/w and 60% m/m – much the same for the entire state of California where reefer volumes are up 6% w/w and 53% m/m.
This week’s USDA reported seasonal year-over-year volumes of produce improved but are still down 5% for domestic and 12% for imported truckload shipments, which is just over 3,300 fewer loads of produce compared to the same week in 2019. A shortage of trucks was reported for watermelons and cantaloupes for the second week in Maryland, Delaware and Eastern Shore Virginia, Southwest Indiana, Southeast Illinois, North and South Carolina, and Southeast Missouri. The USDA report also noted a slight shortage of trucks was reported for citrus and avocados from South District California; sweet potatoes from Eastern North Carolina; onions from Southern New Mexico, and apples, pears, cherries, peaches, nectarines and prunes from Yakima Valley / Wenatchee District in Washington.
> Learn more about the Market Conditions Index
Load-to-truck ratio
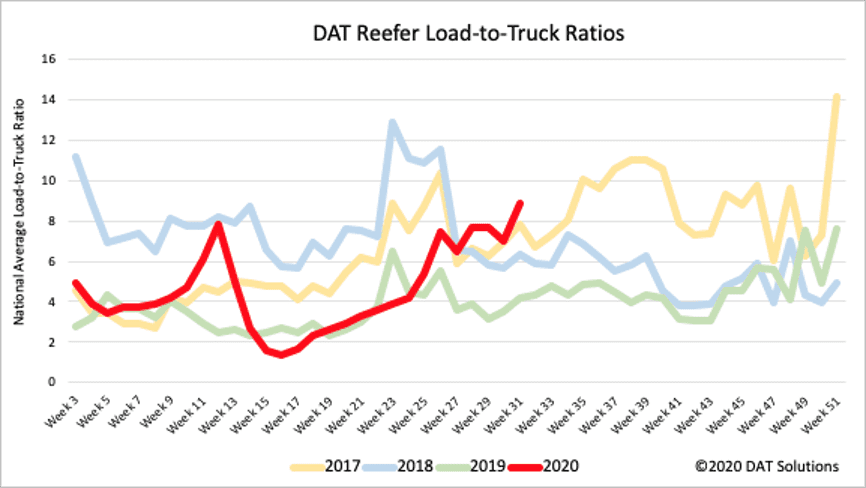
After dropping for the prior three weeks, last week’s reefer LTR increased by 27% to 8.89, which is more than double the same time last year. Refrigerated load posts jumped by 15% to 604,000 loads, which contributed to the highest recorded LTR for this time of the year. Similar to the dry van sector, reefer capacity also tightened last week with 10% fewer trucks searching for loads.
> Learn more about the DAT One load board network
Spot reefer rates
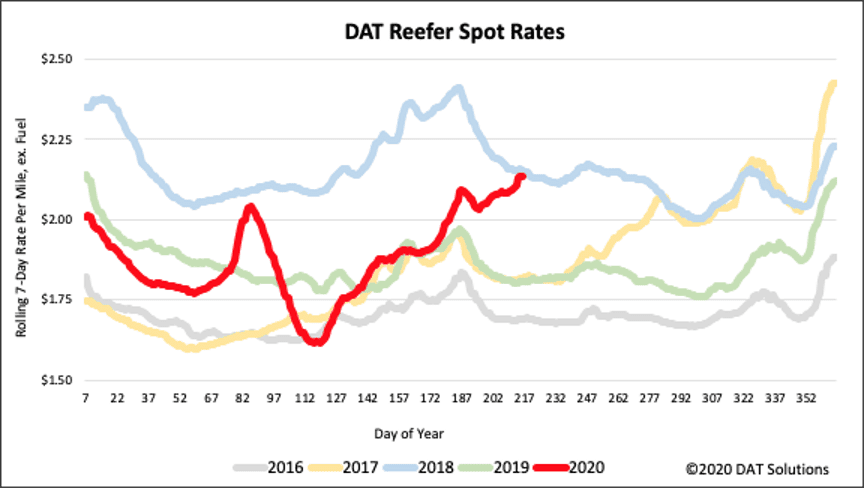
National average reefer rates continued to rise, increasing 5 cents to $2.14/mile excluding fuel, which is around the same level as in 2018. The unseasonal rise in rates reflects the challenges shippers are facing to source capacity for retail non-durable goods, as consumers continue to dine mostly at home. Higher outbound volumes ahead of Tropical Storm Isaias drove up reefer rates in Florida by just over 3% w/w with the largest spot rate increase occurring in the Jacksonville market, where capacity was much tighter causing reefer rates to jump by 12% to $2.52/mile.
Available capacity was also tighter in Indianapolis last week on higher volumes, which have been increasing for the past five weeks and now up 9% w/w and 30% m/m. Reefer loads out of Indianapolis to Atlanta and Lakeland markets were the top paying lanes at $2.97/mile and $2.87/mile respectively.
All of our forecast models are in agreement on where rates are headed in the next month. Our Ratecast model expects reefer rates to shift higher by around 3 cents to $2.17/mile. With signs of a reset or at least a slowdown in the reopening of the economy gaining momentum this week, strong demand for non-durable goods in the food and beverage sectors should continue to drive reefer volumes on the spot market in the short-term.
> Learn more about freight rate tools from DAT iQ
Reefer forecasts
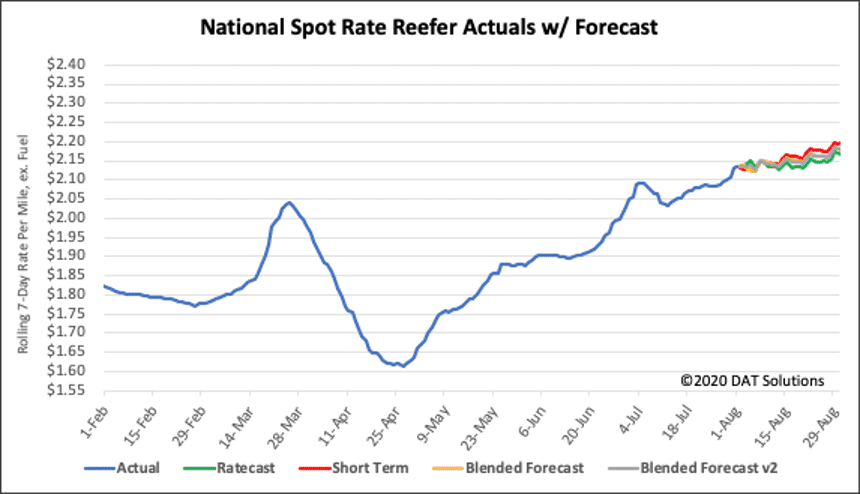
How to interpret the rate forecast
- Ratecast Prediction: DAT’s core forecasting model
- Short Term Scenario: Formerly the pessimistic model that focuses on a more near-term historical dataset.
- Blended Scenario: More heavily weighted towards the longer-term models.
- Blended Scenario v2: More heavily weighted towards the shorter-term models.
> Learn more about rate forecasts from DAT iQ
Flatbed trends
Market Condition Index (MCI)
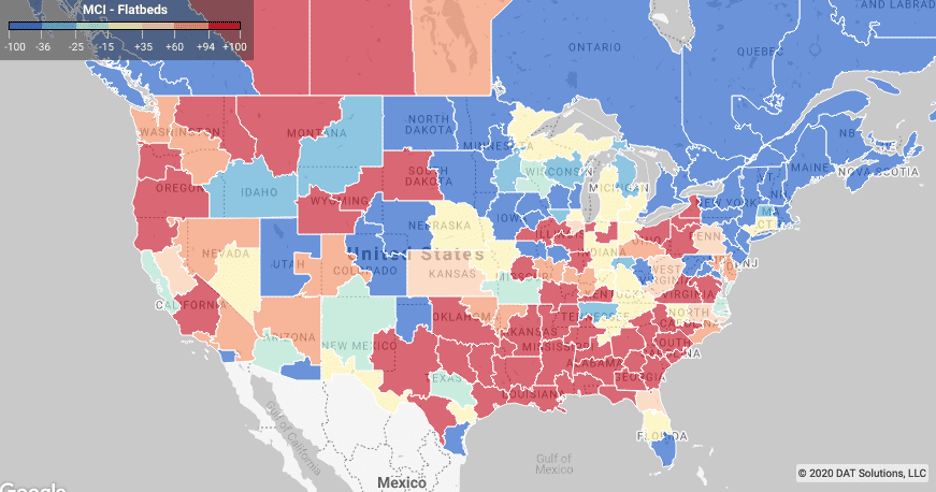
The U.S. Census Bureau Manufacturing reported some positive signs for the flatbed sector. June data showed the value of new orders for manufactured goods (excluding transportation equipment) increased for the second month in succession. New orders and shipment values both increased by 4.4% for all industries in June while the inventories-to-sales ratio dropped from 1.65 in May to 1.51 in June for all industries.
For the durable goods sector, excluding transportation equipment, the inventories-to-sales ratio for durable goods dropped from 1.78 to 1.68 in June. Non-durable goods dropped from 1.61 to 1.54 in June. The home improvement and building industry continues to drive strong volumes – at the end of June 2020 the volume of loads hauling building materials and lumber were up 67% y/y and 142% y/y respectively. Since April when the lumber industry came to a standstill, monthly load counts have more than doubled for the building materials category and more than tripled for loads of lumber.
> Learn more about the Market Conditions Index
Load-to-truck ratio
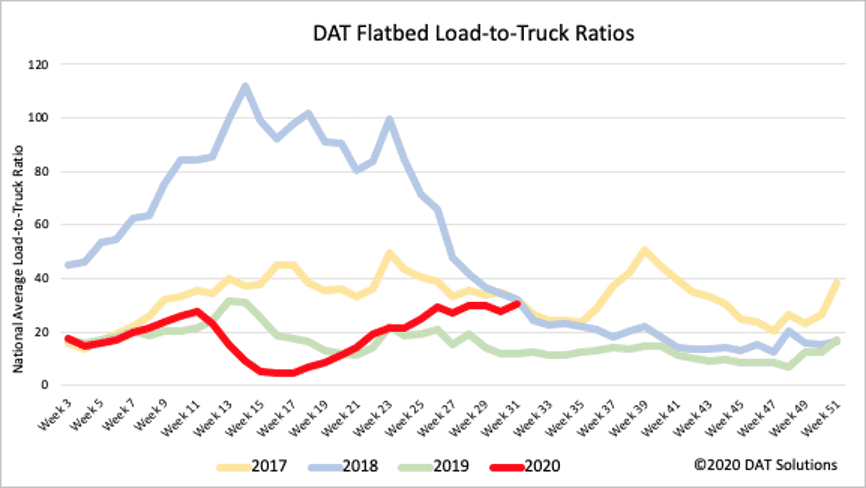
Flatbed load posts increased by 1% last week and are showing signs of plateauing, as retailers restock depleted lumber and build material inventories. Capacity tightened also with 9% fewer carriers searching for loads, which had the effect of increasing the flatbed LTR by 9% last week to similar levels observed in 2017 and 2018.
> Learn more about the DAT One load board network
Spot flatbed rates
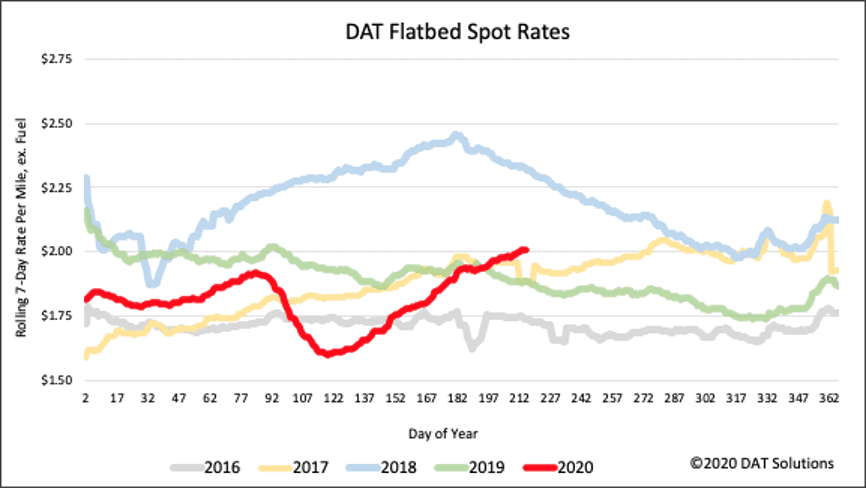
Flatbed spot rates inched higher again last week, increasing 3 cents to $2.01/mile excl. FSC. Flatbed rates are now 6% higher y/y but when compared to the same week in 2018 when capacity was very tight, last week’s spot rate is still around 32 cents lower. Rates for loads of lumber specifically are slightly higher at $2.23/mile and building materials are slightly higher again at $2.26/mile, reflecting the recent surge in demand in the building and home improvements sectors.
With signs that the flatbed market is cooling as spot market loads hover around the same level for the last four weeks, our Ratecast model expects flatbed rates to follow their seasonal trend and decline by around 8 cents to $1.93/mile over the next month.
> Learn more about freight rate tools from DAT iQ
Spot rate forecasts
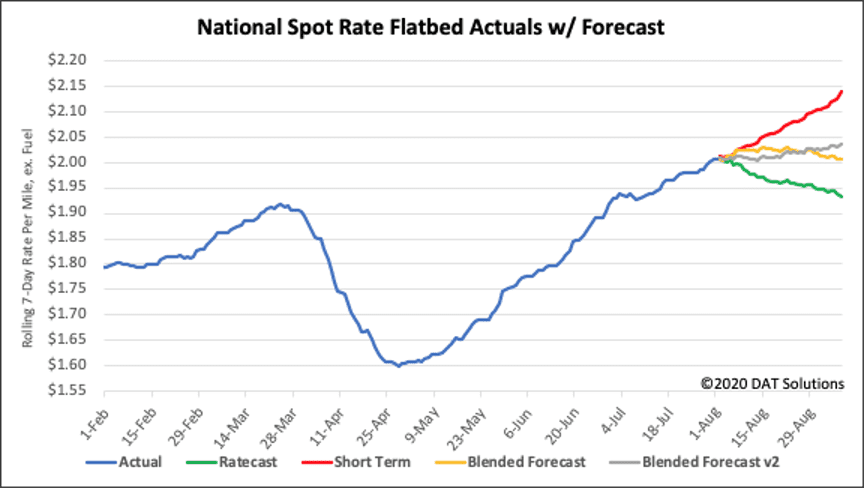
How to interpret the rate forecast
- Ratecast Prediction: DAT’s core forecasting model
- Short Term Scenario: Formerly the pessimistic model that focuses on a more near-term historical dataset.
- Blended Scenario: More heavily weighted towards the longer-term models.
- Blended Scenario v2: More heavily weighted towards the shorter-term models.
> Learn more about rate forecasts from DAT iQ
Need more information?
Our update will be refreshed next week, or sooner if conditions change materially. Any questions on this report or market conditions can be emailed to askIQ@dat.com.
We are also making available, free of charge, the DAT Daily 50 which is a daily report of the top 50 lanes by volume with a week’s worth of history and predictions using the Ratecast model.


