The American Trucking Association’s (ATA) latest report includes good news on the heavier side of the freight economy. The seasonally adjusted For-Hire Truck Tonnage Index — which is dominated by contract freight as opposed to spot market freight — increased 2.4% in September after rising just 0.3% in August.
Find loads and trucks on the largest load board network in North America.
Note: All rates exclude fuel unless otherwise noted.
Compared with September 2020, the index is up 1.7%, which was the first year-over-year gain since May this year. Truckload tonnage remains unchanged on a year-to-date basis.
According to ATA Chief Economist Bob Costello:
“September’s sequential gain was the largest in 2021 and it is good that tonnage rose in September, but it is important to note that this is happening because each truck is hauling more, not from an increase in the amount of equipment operated as contract carriers in the for-hire truckload market continue to shrink from the lack of new trucks and drivers. The drivers of truck freight, including retail, construction, and manufacturing, plus a surge in imports, are helping keep demand high for trucking services.”
No relief on the horizon
Container ships continue to pile up off the Los Angeles coast with many more on the way. California’s governor Gavin Newsom signed an executive order (EO) aimed at taking pressure off the ports of Los Angeles and Long Beach by directing state agencies to look for additional container storage space.
The EO has asked agencies to find state-owned properties and other sites that can store containers that are sitting at California ports. In addition to addressing space constraints, the EO includes the identification of additional truck routes that would be exempt from gross vehicle weight limits.
The Journal of Commerce (JOC) reported the EO came a day after Port of Los Angeles executive director Gene Seroka sent a letter to President Joe Biden. The letter asks that a long-term, local upgrade be included in the $17 billion Infrastructure Investment and Jobs Act. It would set money aside for port spending, including the development of 80 acres nearby Terminal Island that would serve as overflow storage for containers.
According to The Marine Exchange, there were 77 container ships loaded with 560,940 TEU (twenty-foot equivalent unit) waiting to find a berth to unload as of this Monday. These ships contain much-needed imports ahead of the retail shopping season.
The Port of Los Angeles Signal report lists the average wait time at anchor around 12.8 days, down from 12.9 days the prior week.
Congestion spreads from sea to land
With limited space to store loaded containers, the port is quickly grinding to a standstill as evidenced by the long lines of trucks waiting to both return empty containers and pick up loaded ones.
The jam of container ships is not the only problem. Residents of the Wilmington neighborhood just north of the ports are now seeing container trucks backed up in residential streets at all hours of the day.
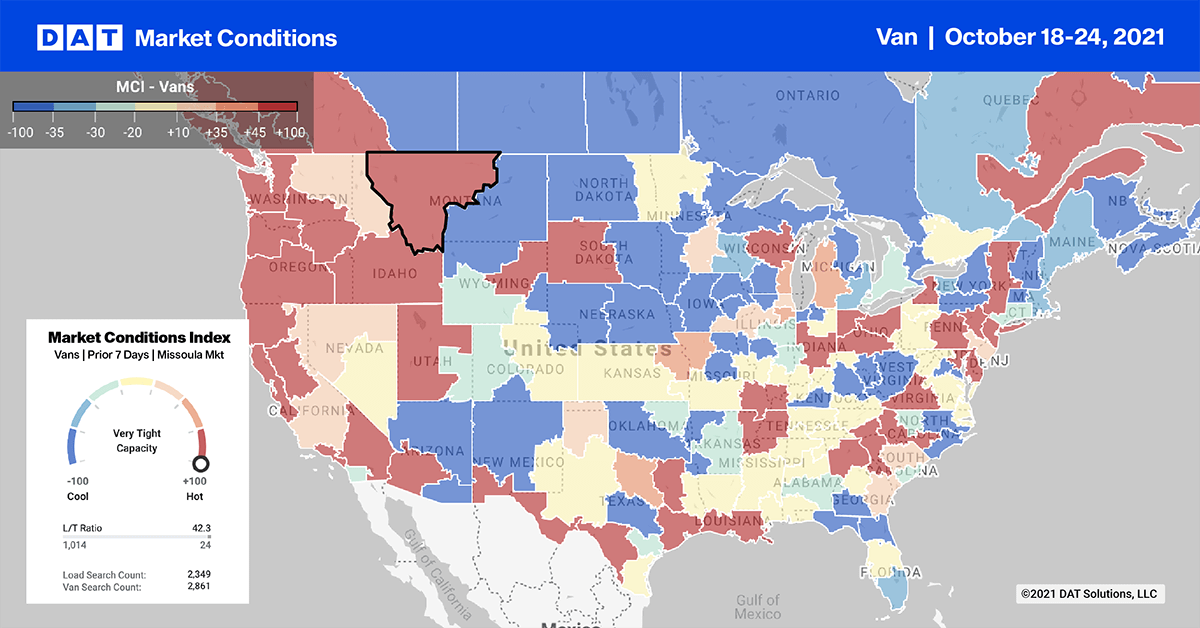
Truckload capacity in the Los Angeles markets remains tight as a result. There was no change in average outbound spot rates last week at $3.32/mile. However, high-volume freight lanes including Stockton, Phoenix and Chicago, set new all-time highs for average line haul spot rates last week.
Loads from Los Angeles to Stockton averaged $4.19/mile, east to Phoenix averaged $4.48/mile while loads to Chicago are at $3.08/mile this week.
Spot rates
Two weeks of declining spot rates doesn’t make a trend. But considering that both dry van contract and spot rates decreased last week, we might be seeing the seasonal cooling in rates we normally expect to see in October.
Spot rates dropped $0.03/mile last week, the largest weekly decrease since mid-June to end the week at an average of $2.49/mile. Dry van rates are still 12% or $0.30/mile higher than this time last year and an amazing $0.72/mile higher than the 2018.
Of our Top 100 lanes (for loads moved), spot rates:
- Increased on 23 lanes (compared to 25 the week prior)
- Remained neutral on 38 lanes (compared to 16)
- Decreased on 39 lanes (compared to 32)
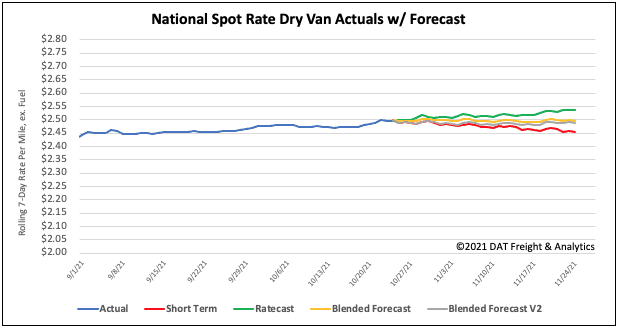
How to interpret the rate forecast:
- Ratecast: DAT’s core forecasting model
- Short Term Scenario: Formerly the pessimistic model that focuses on a more near-term historical dataset
- Blended Scenario: More heavily weighted towards the longer-term models
- Blended Scenario v2: More heavily weighted towards the shorter-term models