The Port of Savannah ranks number four in the country for loaded container imports. It’s the first container terminal in the Southeast or Gulf Coast to move 5 million twenty-foot equivalent (TEU) container units in a fiscal year.
According to the IHS Markit PIERS database, June’s TEU import volumes were 35% more than the same time last year, although sequential volumes declined 9%. However, the Georgia Ports Authority (GPA) has plans for expansion.
“The Savannah Harbor deepening, the Mason Mega Rail terminal and other capacity enhancements are not only preparing GPA for the present influx of cargo, but also for future demand with an abundance of near-port property available for development,” says GPA Executive Director Griff Lynch. “GPA is right now adding millions of TEUs of additional capacity in Savannah.”
Find loads and trucks on the largest load board network in North America.
Note: All rates exclude fuel unless otherwise noted.
The number one commodity imported via container is furniture at 16% of TEU volume with just under half coming from China. Vietnam ranks second with 20% followed by Singapore at 8% of furniture volume.
Overall, the volume of furniture imports almost doubled in June compared to June 2020 and accounted for 40% of TEU volume in Savannah. The decrease in June monthly volumes translated to declining truckload volumes (down 48%) on the spot market as capacity eased and spot rates dropped 6% to an average of $2.68/mile. The number one destination for loads out of Savannah is Atlanta where spot rates are averaging $3.62/mile this week, down $0.57/mile since June’s peak.
The West Coast ports of Long Beach and Los Angeles continue to grab attention as large container ships begin to bunch up again outside the busiest U.S. port complex where about one-third of all container imports arrive.
Adding to delays is the ongoing chassis trailer shortage exacerbated by higher-than-normal container dwell times for local container delivery and intermodal rail cars to move containers east. All of this is contributing to higher spot market truckload volumes off the West Coast as shippers struggle with reduced intermodal capacity on freight lanes to congested inland destinations.
For carriers and brokers operating in this market, it’s highly likely that the urgency to move delayed freight from the port will continue to drive higher spot market volumes and rates. On the benchmark ecommerce import lane from Los Angeles to Phoenix, spot rates increased by $0.10/mile last week to an average of $4.41/mile.
“With marine terminals now handling 20% to 30% more imports than they were last summer, and holiday merchandise already beginning to arrive at the ports and building toward the September-October peak, it is difficult to imagine that conditions will improve anytime soon,” says Ed DeNike, President of SSA Containers.
Spot rates
Despite last week being end-of-month where we’d normally expect to see a surge in shipping volumes, the dry van spot market was relatively quiet last week. Spot rates moved up by just $0.01/mile to an average of $2.42/mile. Dry van rates are still $0.52/mile higher than this time last year and $0.54/mile higher than this time in 2018.
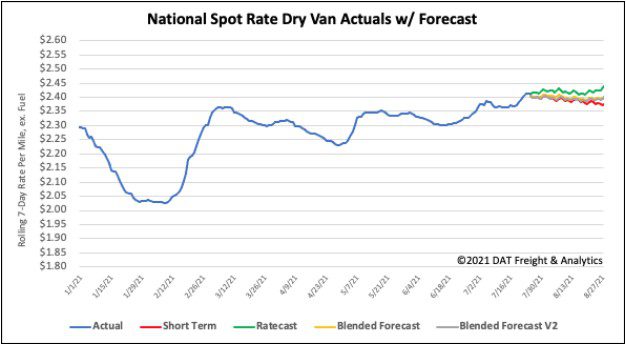
How to interpret the rate forecast:
- Ratecast: DAT’s core forecasting model
- Short Term Scenario: Formerly the pessimistic model that focuses on a more near-term historical dataset
- Blended Scenario: More heavily weighted towards the longer-term models
- Blended Scenario v2: More heavily weighted towards the shorter-term models