Strong import volumes continue to clog supply chains that are desperately trying to replenish depleted inventories. This continued demand for trucking and intermodal capacity at ports remains a challenge.
The U.S. has leaned heavily on Asian trading partners, with the majority of import volumes being funneled into ports in Los Angeles and San Francisco. The most recent report from C.H. Robinson on the North American Freight Market noted that shippers are currently facing 20-30 day delays, cutting into lead time between Asia and the U.S. The report states that more import container moves are being terminated at the port and being “cross-docked to truck versus intermodal/rail for the container move inland.”
Adding to the delays, vessels are also waiting longer inside the Port of Los Angeles, with up to 30 container vessels waiting at anchor at any given time. Fulfillment centers are also overloaded and “when a container is waiting at a warehouse, it’s now sitting for about eight days compared to the usual three and a half days during pre-pandemic times,” according to Gene Seroka, executive director of the port.
He expects current backlogs to continue at least until mid-summer.
Find dry van loads and trucks on the largest load board in North America.
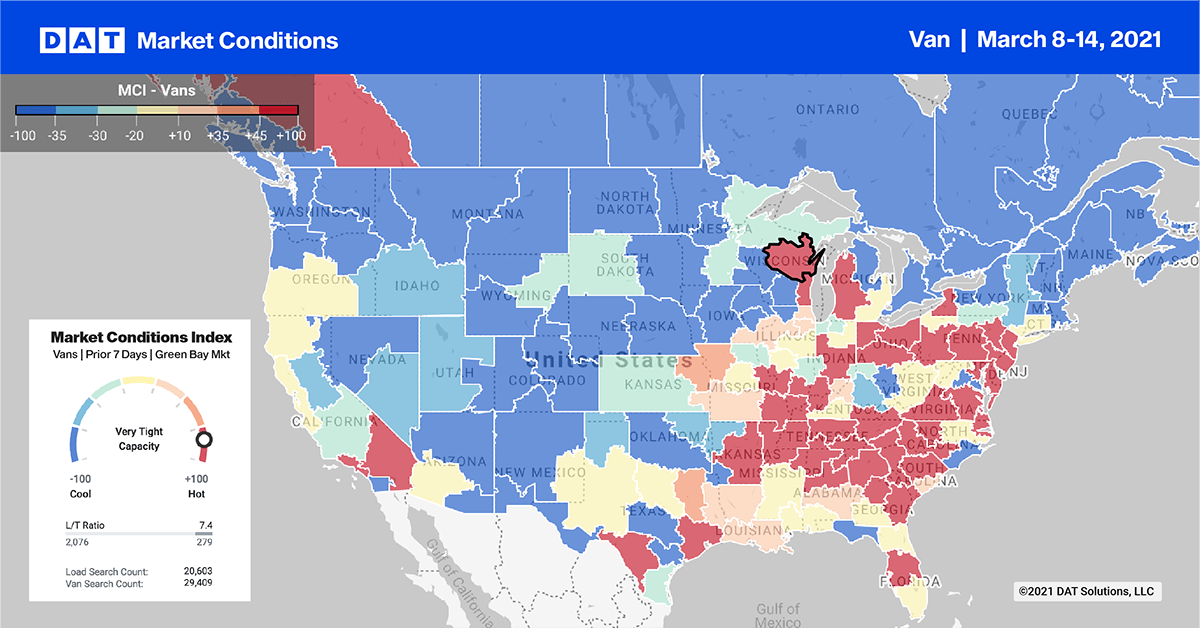
Dry van load posts dropped for the second week in a row, decreasing 18% in the top 10 markets. The average spot rate stayed around $2.62/mile (excluding fuel) for all outbound loads, with tight capacity offsetting the lower volumes.
Load posts fell 10% in Memphis, but capacity was tight enough to push rates up $0.04/mile to an average of $2.83/mile, excluding fuel. Harrisburg, PA, was the only other major market to post higher rates on lower volumes.
In Atlanta, both volumes and spot rates were down: Outbound load posts fell 13% while rates dropped slightly by $0.01/mile to $2.41/mile. Available capacity remains tight on the West Coast even though load volumes were down 27% in both Los Angeles and Ontario, CA. Spot rates were up $0.01/mile to $2.89/mile and $2.62/mile respectively.
Spot rates forecasts
After 35 days of increasing spot rates, the dry van market cooled last week. Rates crested at $2.42/mile excluding fuel, decreasing slightly at $0.03/mile from the prior week. Spot rates remain up 34% year over year, or $0.83/mile compared to the same week in 2020.
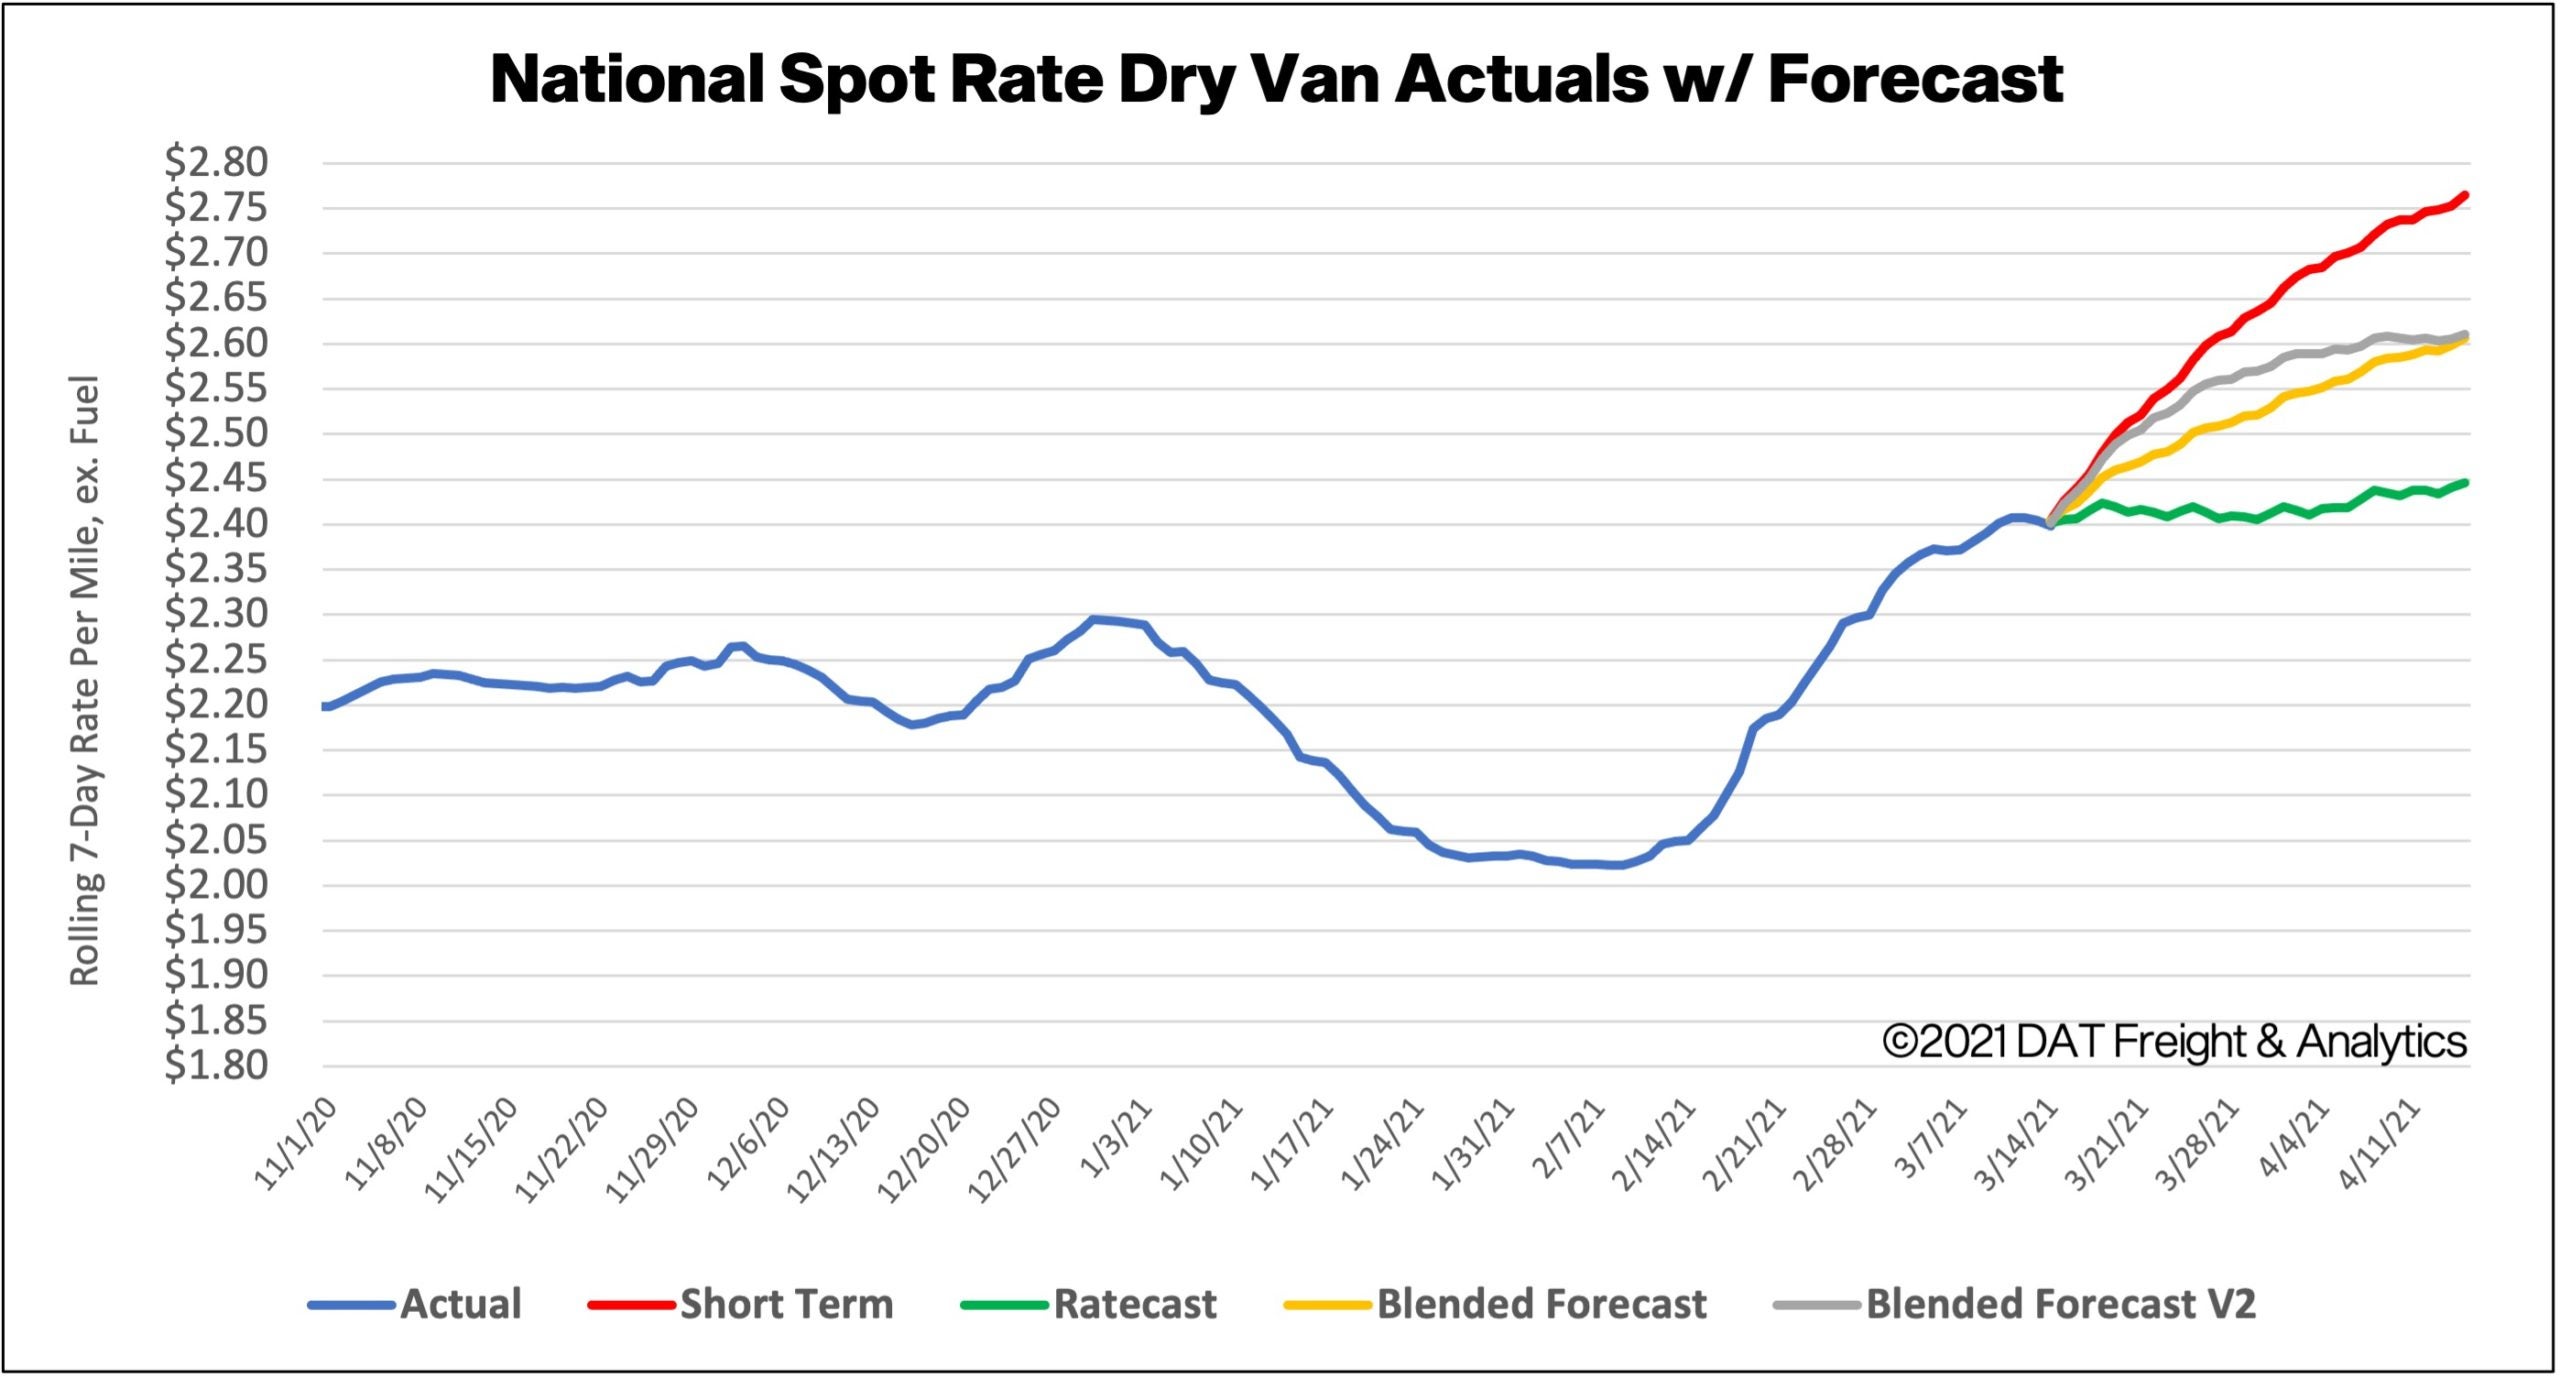
How to interpret the rate forecast:
- Ratecast: DAT’s core forecasting model
- Short Term Scenario: Formerly the pessimistic model that focuses on a more near-term historical dataset.
- Blended Scenario: More heavily weighted towards the longer-term models.
- Blended Scenario v2: More heavily weighted towards the shorter-term models.


