Historically, increased spot market activity signaled higher overall truckload demand and tighter capacity. This year we’re seeing something of a paradox, with total freight volumes very uneven at the market, commodity and lane levels.
Even in carrier sectors, capacity is tight in some and loose in others. According to the September Pulse Signal from the Freight Market Intelligence Consortium, even though overall volumes are down 3% y/y, some sectors such as retail and consumer packaged goods (CPG) are seeing volumes up 10% y/y. Industrial shippers are seeing the exact opposite.
Even within the sectors posting higher volumes, there are winners and losers, adding to the unevenness in freight volumes. The FMIC report noted, “many do-it-yourself retailers experienced 50% increased volumes while other non-essential retailer volumes were down over 10% year over year.”
This in part explains the record levels of spot market activity we’ve seen, with volume surges concentrated on certain lanes and commodities, where asset-based carriers have been unable or unwilling to commit to their contracted commitments on existing lanes. In cases where carriers have not provided sufficient capacity, shippers have been going deeper into their routing guides or utilizing the spot market for higher volume. Load posts on the DAT One network are up 120% year-over-year so far this fall for dry vans and reefers.
Tune into DAT iQ Live, live on YouTube or LinkedIn, 10am ET every Tuesday.
How long will this last? That’s the question on everyone’s lips, with a general consensus that upward pressure on spot and contract rates could remain through the year-end as shippers in grocery and retail continue to replenish and stockpile depleted inventories and begin building “pandemic pallets”. Food companies are particularly concerned about another widespread outbreak of COVID-19 cases in winter and the possibility of new restrictions driving another surge in CPG demand on top of the upcoming holiday shopping season.
Last week’s news that Walmart and Target plan to hold online sales events at the same time as Amazon Prime Day on October 13 explains in part the recent surge in e-commerce related imports and suggest peak holiday shipping season may have already occurred. At some point in the near term, capacity will catch up to demand but for the moment, market equilibrium is way down the road.
Dry van trends
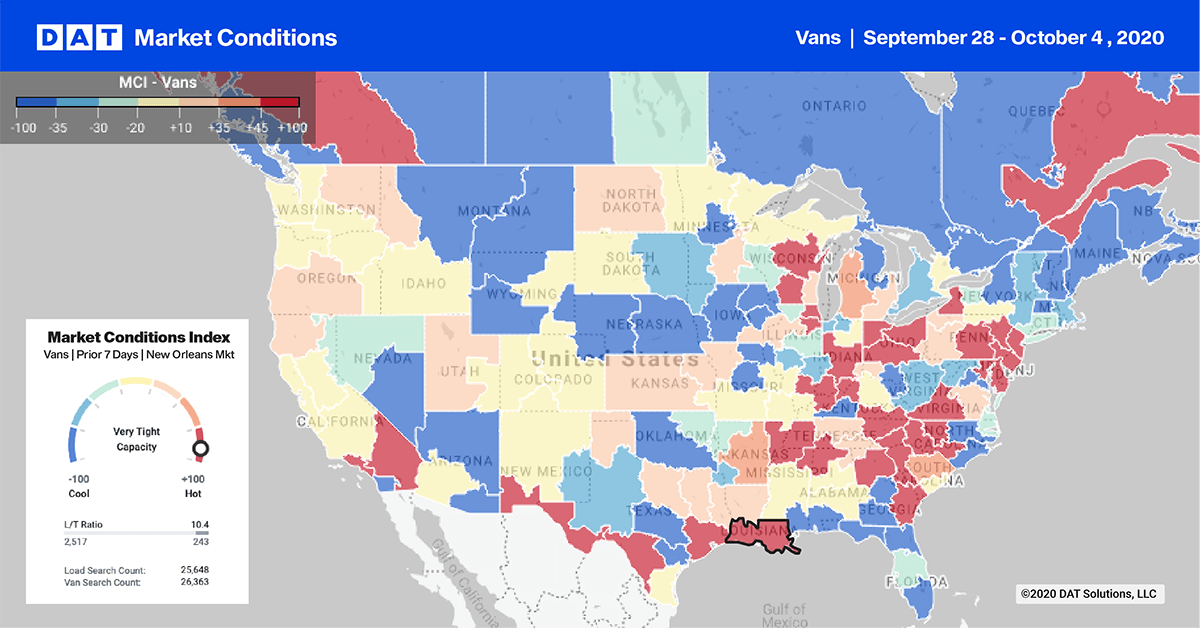
> Learn more about the Market Conditions Index
Tight capacity is still driving spot rates higher in key markets even though load post volumes are declining. On the West Coast in Los Angeles and Ontario, CA, volumes are down 7% week over week after posting three successive weeks of gains. In contrast, dry van spots rates were up for the second week.
In San Diego and San Francisco, load volumes were up slightly. Farther north in the Pacific Northwest markets of Seattle and Portland, outbound load volumes were down 9% w/w.
In Savannah, GA, outbound volumes dropped 3% after three weeks gains. There’s a similar trend in Baltimore, where volumes dropped 12% w/w. Farther north in the large import market of Elizabeth NJ, volumes are now down 18% m/m. Volumes in Houston have been relatively flat for the last three weeks, although available capacity is still tight.
Combined, the top 10 ocean ports as measured by outbound load post volumes are down 6% w/w while spot rates are up just over 2%.
Reefer trends
Produce shipments continue to slide, according to the latest report from the USDA. Both domestic and imported produce shipment volumes generally peak in June each year, with domestic volumes representing around 60% of total annual truckload produce volumes. Since the annual peak, domestic volumes have declined by 32% and remain down 24% y/y based on last week’s USDA shipment data.
Offsetting lower produce volumes this season is increased demand in the frozen food sector, witgh consumers buying food with longer shelf lives. According to IRI who capture point-of-sale consumer data, total demand for Consumer Packaged Goods (CPG) for the week ending Sept 9 increased by 9% y/y while refrigerated foods, a subset of total CPG sales, increased by 13% y/y.
Freight volumes in the Pacific Northwest (Spokane, Seattle, Medford, Twin Falls & Pendleton) cooled off last week and are down 25% m/m as overall. Produce volumes have slowed and reefer capacity has eased in that area, which pushed overall outbound rates from these markets down after peaking two weeks ago.
Flatbed trends

The manufacturing sector contributes significantly to flatbed freight volumes, and the Institute of Supply Management Manufacturing Purchasing Managers Index showed a boost in September (PMI). Manufacturing growth continued for the fifth consecutive month, although the rate of growth rate slowed from the two-year high recorded in August. Of the six largest manufacturing industries, Food, Beverage & Tobacco Products was the best-performing sector in September, while the flatbed freight intensive Fabricated Metal Products sector reported strong growth.
This week’s Market Condition Map highlights the capacity imbalance we’ve been watching for the last five months, but it’s more prevalent for flatbed, where carriers typically haul more one-off project-related freight, run more deadhead miles and have fewer backhaul opportunities compared to the dry van and reefer sectors. As a result, big surges in demand such as we’ve seen this summer in the wood products and building materials categories create even bigger dislocations in equipment at the market level.
In the Southwest, outbound volumes in Texas were up 8% w/w, and rates rose out of the Dallas and Fort Worth market. In the Alabama markets of Montgomery, Decatur and Birmingham, which account for 8% of flatbed load posts nationally, outbound load volume has dropped 12% w/w. Load posts also dropped 8% from Memphis after four weeks of gains.


