Truckload capacity is tight and expected to get tighter, but judging where truckload demand is headed remains challenging as COVID-19 headwinds ease and increasing tailwinds from the vaccine distribution and economic stimulus converge.
According to the latest shipper data from the Freight Market Intelligence Consortium – a group of leading shippers that rely on DAT iQ data to inform their operations – January contract freight volumes are up 1% year over year, but spot volumes are up an amazing 47% y/y. The combination of both shows freight volumes up 5% y/y.
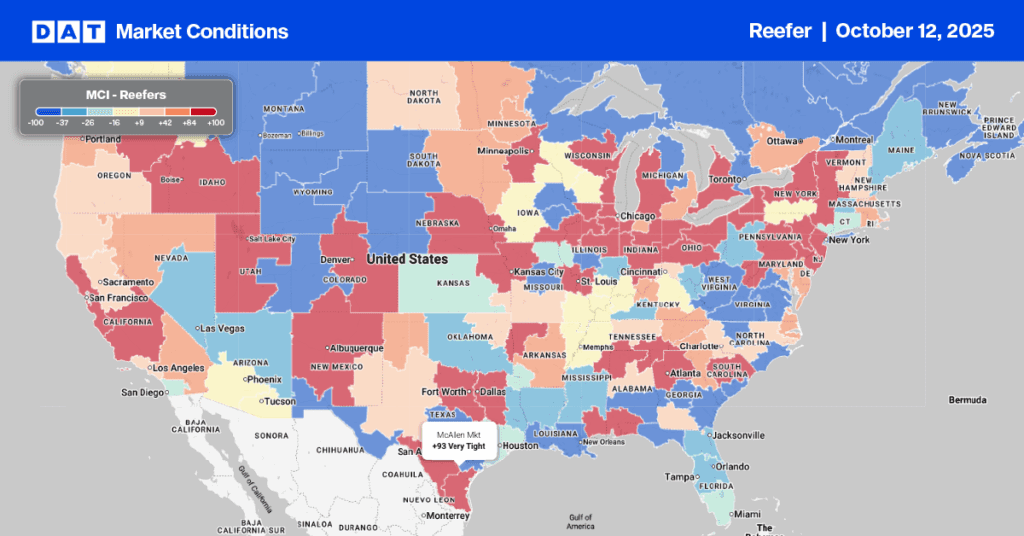
In the temperature-controlled sector, the results are not so good due to the devastation being experienced in the food services sector. Total shipper reefer volumes are down 3.3% y/y, but when we separate out contract loads from spot, contract volumes are down 6% y/y but spot volumes are up 22% y/y.
Get the clearest, most accurate view of the truckload marketplace with data from DAT iQ.
Tune into DAT iQ Live, live on YouTube or LinkedIn, 10am ET every Tuesday.
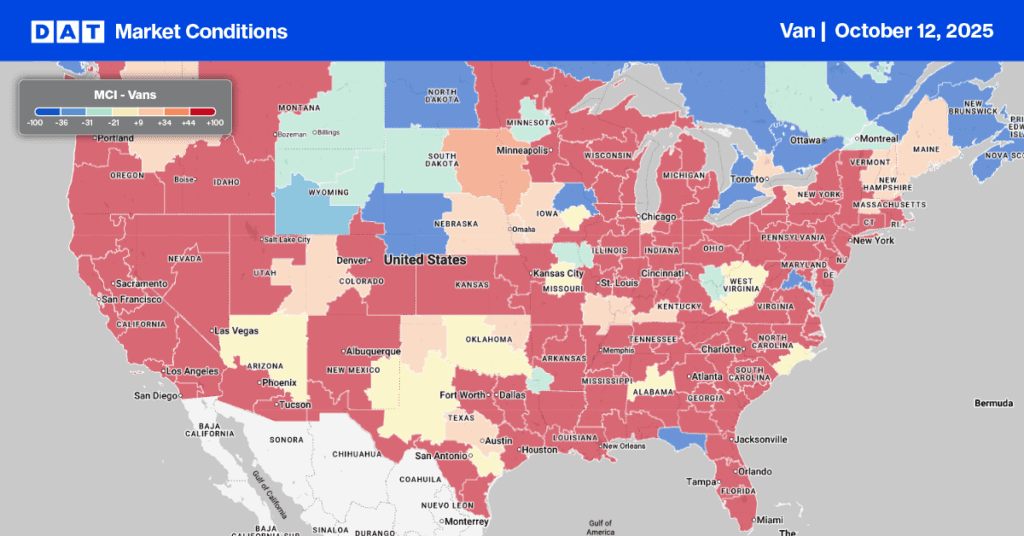
Higher spot market volumes have been a feature of the freight market over the last nine months, resulting in the ongoing imbalance we’re seeing at the commodity and lane level. This week we’re even seeing this play out national level, with every market west of the Rockies recording negative week-over-week changes in load posts on the DAT One network, and almost every market on the East Coast on the positive.
At a market level, Los Angeles volumes are down 46% month over month, whereas Elizabeth, N.J, volumes are up 15% m/m. These freight markets are also home to two of the largest ports in the country, where January import volumes were down 7% y/y on the West Coast and up 14% y/y on the East Coast.
The most recent PIERS data from IHS Markit points to shift in import volumes away from the heavily congested West Coast to ports along the Gulf Coast and up and down the entire East Coast. Total TEU (twenty-foot equivalent unit) volumes for January are down 1% y/y after being up 22% in December 2020, which resulted in record-level congestion at the Port of Long Beach and Los Angeles.
The backlog of inventory sitting in containers on vessels at anchor has tied up prepaid freight for weeks in some cases. According to the Marine Exchange of Southern California, which monitors ship traffic, at the start of February there were 37 container ships anchored off Los Angeles compared to just one at the same time in 2020. This week there are still 34 cargo vessels waiting for a berth.
Imports from China accounted for 60% of imports in January on the West Coast but due to congestion at Los Angeles ports, TEU volumes decreased by 12% y/y at the Port of Los Angeles and 15% y/y in Oakland. In contrast, New York container volumes were up 14% y/y, Savannah, GA, up by 3% y/y, Norfolk, VA, up 21% y/y and Charleston, SC, up 8% y/y — these four East Coast ports account for 80% of January TEU import volume.
Typically, we see import volumes on the transpacific trade lane fall away in March following Chinese New Year, but with the backlog of freight on vessels still to work its way into truckload markets, it’s conceivable the usual March slowdown won’t happen and we’ll roll right into the Spring shipping and Summer produce season without missing a gear.