As retailers get ready for the holiday shopping season, a lot of the required inventory has already been hauled by carriers and positioned in warehouses across the country, following the peak in imports we had back in August. But obviously, retailers are approaching the holiday season differently this year.
Firstly, we’re expecting to see more shopping online this season, and this week includes online sales events by major retailers like Amazon, Walmart and Target. All of that freight is already in warehouses, so we saw spot market demand decline last week. But this shows how retailers are expecting an earlier and more extended holiday shopping season, with more products suitable for shipping or pickup.
Tune into DAT iQ Live, live on YouTube or LinkedIn, 10am ET every Tuesday.
As more of us spend more time at home during the pandemic for studies, work and entertainment, demand for electronic equipment has skyrocketed. Global shipments of televisions hit a historical high in the third quarter of this year. According to Trendforce, global TV shipments were just over 62m in the third quarter, of which 31% (19 million) were shipped to the US. Of those shipped, 63% came from China, and 65% of that volume landed in Los Angeles.
This is just one example of how the pandemic has increased demand for certain commodities and driven important truckload volumes higher in specific markets, and it looks set to continue well into 2021. For truckers, this all will likely mean a continuation of what we’ve been seeing for the past five months – tight capacity and high demand for fast-moving consumer goods, and sluggish demand in the industrial manufacturing sector.
Van trends
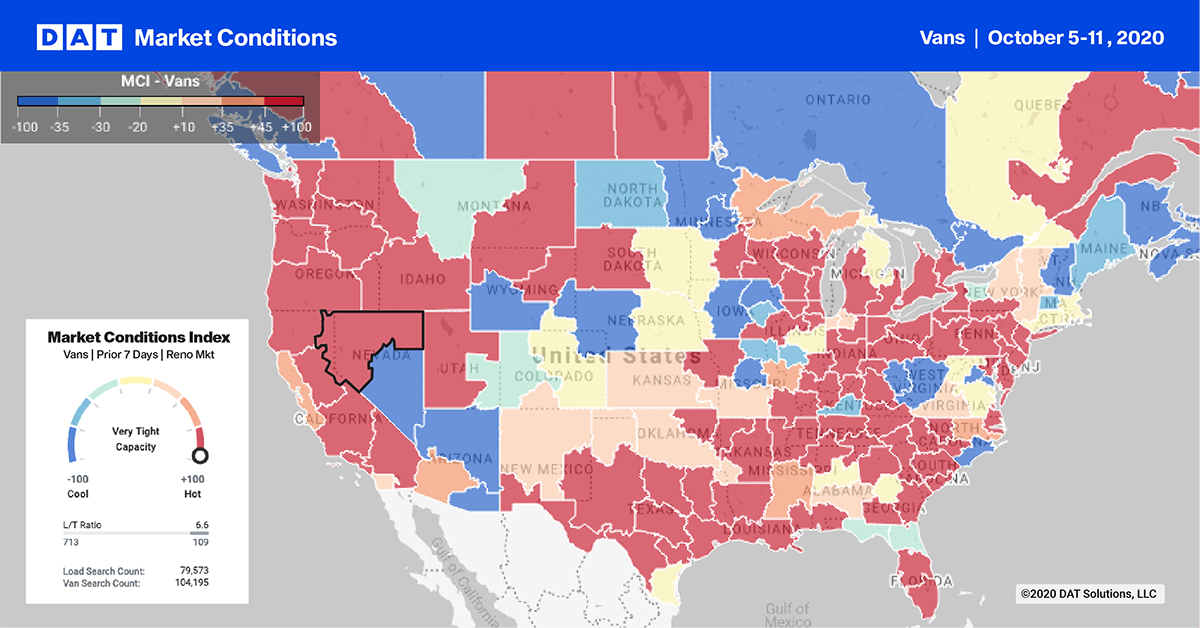
> Learn more about the Market Conditions Index
This week’s release of the Michigan State University For-Hire Trucking Ton-Mile Index for August 2020 highlights a 0.4% m/m increase, although overall volumes were still down 2.7% year-over-year. Associate Professor Jason Miller at the Eli Broad College of Business noted, “while our index is more bullish than ATA and Cass for the recovery of trucking demand, it reinforces multiple independent data points that indicate overall demand is still down year-over-year.”
From a capacity perspective, the MSU release indicated the Trucking Capacity Tightness Index remained at record high levels in August, but unlike early 2018, capacity tightness in late 2020 is driven by a decline of trucking employment as opposed to strong yearly gains in demand.
In our top 10 freight markets, which account for 23% of total load posts, load post volume was down 14% last week. Noticeable volume decreases were recorded in Memphis (ranked #1 last week), where volume dropped by 2% w/w followed by Atlanta (#2) down 17% w/w. On the West Coast in Los Angeles (#3) and Ontario, CA, (#5) markets, load posts dropped 16% and 20% w/w respectively. Available capacity eased slightly, with outbound rates decreasing by 1% to an average.
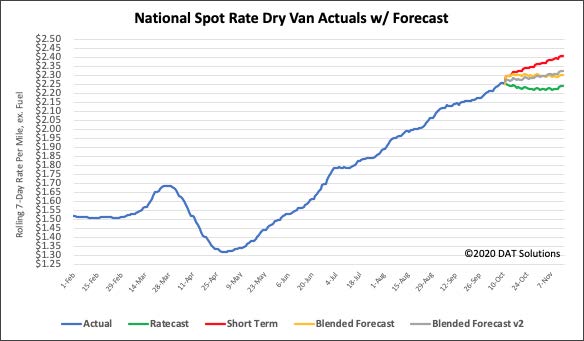
Forecasting during this volatile period is difficult. Our team is working diligently to update and adjust the models, but new information becomes available at a rapid pace. DAT would typically not publish these types of preliminary studies, but we feel that the benefit of sharing our observations far outweighs the risk. We ask that you please treat these statements and exhibits as directional and consider them as a variable in your own analyses.
How to interpret the rate forecast
- Ratecast Prediction: DAT’s core forecasting model
- Short Term Scenario: Formerly the pessimistic model that focuses on a more near-term historical dataset.
- Blended Scenario: More heavily weighted towards the longer-term models.
- Blended Scenario v2: More heavily weighted towards the shorter-term models.
> Learn more about rate forecasts from DAT iQ
Reefer trends
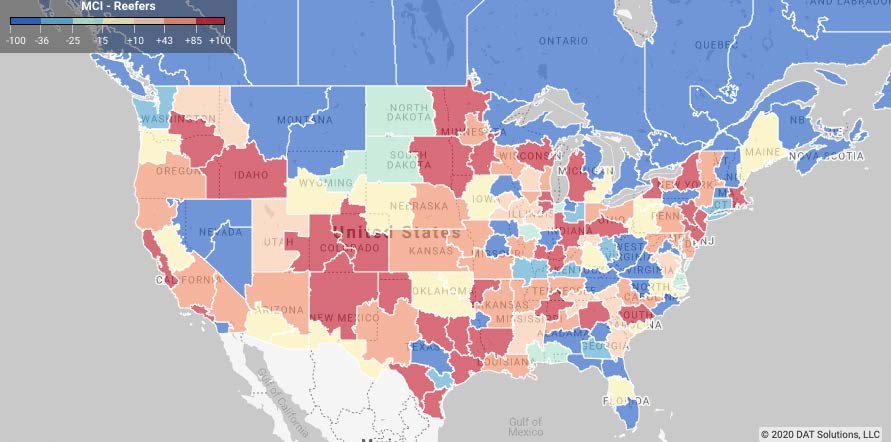
> Learn more about the Market Conditions Index
With just a couple weeks to go until Halloween, there’s peak demand for carved and processed pumpkins. According to the USDA, 62% of pumpkin production comes from just 10 states, Illinois produces twice as many pumpkins as any of the other top States. It’s also the nation’s largest producer of pumpkins for pies and other processed foods. The top five pumpkin-producing states include Illinois, Pennsylvania, Indiana, Texas and California produce around one billion pounds annually or the equivalent of 25,000 truckloads.
Just under 40% of that volume comes from Illinois where they’ll ship approximately 12,500 truckloads between mid-September and the start of November. In the Rock Island IL market, where there’s the highest concentration of pumpkin farming in the state, outbound reefer volumes were up 34% m/m with rates up 6 cents on average.
In the top 10 refrigerated markets, which account for 22% of total load posts, load post volumes were down 9% last week. Elizabeth, NJ (ranked #1 last week), home to the largest seaport on the East Coast, recorded a load post volume decrease of 15% w/w and is now down 20% m/m. Further south in Philadelphia (#4), reefer volumes dropped 22%. On the West Coast in Los Angeles (#6) load post volumes decreased by 7% w/w, and in the large agricultural produce market of Fresno (#18) to the north, outbound volumes were down 22% w/w.
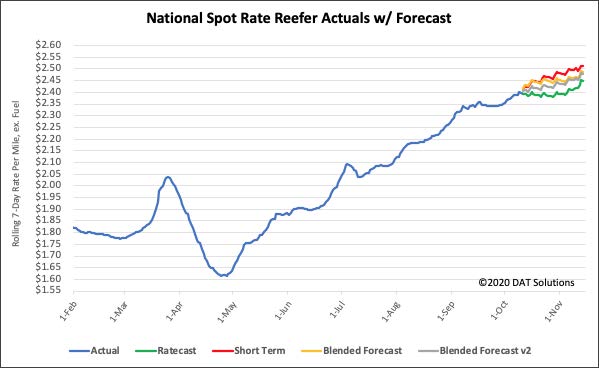
- Ratecast Prediction: DAT’s core forecasting model
- Short Term Scenario: Formerly the pessimistic model that focuses on a more near-term historical dataset.
- Blended Scenario: More heavily weighted towards the longer-term models.
- Blended Scenario v2: More heavily weighted towards the shorter-term models.
> Learn more about rate forecasts from DAT iQ
Flatbed trends
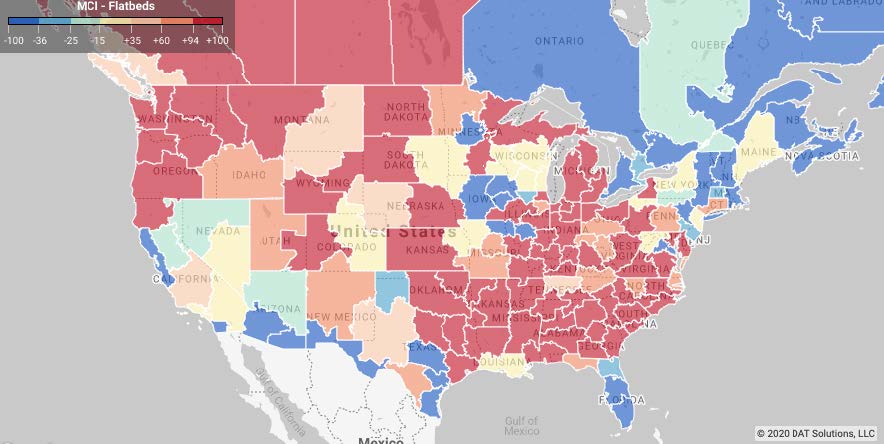
Outbound load post volume dropped by 16% w/w in the top 10 flatbed markets, which account for 27% of total load posts. Volumes in Memphis dropped 11% w/w. Little Rock, AR, recorded a 23% w/w decrease in volume. Alabama markets, which include Decatur, Birmingham and Montgomery, were down 12% w/w. In the top 20 markets, which account for 44% of load post volume, only one market (Detroit) recorded an increase in volume last week.
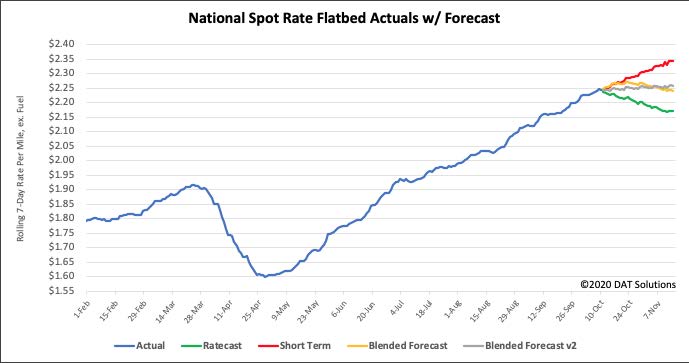
- Ratecast Prediction: DAT’s core forecasting model
- Short Term Scenario: Formerly the pessimistic model that focuses on a more near-term historical dataset.
- Blended Scenario: More heavily weighted towards the longer-term models.
- Blended Scenario v2: More heavily weighted towards the shorter-term models.
> Learn more about rate forecasts from DAT iQ
Need more information?
Our update will be refreshed next week, or sooner if conditions change materially. Any questions on this report or market conditions can be emailed to askIQ@dat.com.
We are also making available, free of charge, the DAT Daily 50 which is a daily report of the top 50 lanes by volume with a week’s worth of history and predictions using the Ratecast model.


