South Texas is the tightest produce origin in the country. All nine lanes out of Mexico crossings through South Texas are now at Slight Shortage — a first in our 2026 tracking. All-in reefer truckload rates climbed again this week, with Dallas up +17%, Miami +9%, and Baltimore +8% on loads of asparagus, broccoli, cucumbers, peppers, tomatoes, watermelons, and other Mexican imports. The cumulative moves over three weeks are dramatic: Dallas has gone from $1,900 to $2,800 (+47%) and Chicago from $3,700 to $5,200 (+28%). With Florida’s crop-damaged supply still depressed, the border is absorbing more demand every week.
Get the clearest, most accurate view of the truckload marketplace with data from DAT iQ.
Tune into DAT iQ Live, live on YouTube or LinkedIn, 10am ET every Tuesday.
Nogales posted the biggest single-lane move in the report — +28% to LA — even as truck availability eased back to Adequate across every lane. Boston cracked $10,000 at the top of the range ($9,700–$10,000) for the first time this year on loads of green beans, sweet corn, cucumbers, squash, tomatoes, and watermelons. Rates rising despite loose capacity signals demand-driven pressure rather than a supply squeeze, which tends to be stickier and harder to predict.
Florida is range-bound. After four weeks of declines and a one-week bounce, Central and South Florida rates barely moved — New York ticked up +3%, Baltimore and Boston held flat, and Atlanta slipped -4% to $1,100–$1,300 on loads of beans, peppers, strawberries, tomatoes, and squash. Four of six lanes remain at Slight Shortage, but the weather-damaged crop supply means fewer loads to haul, keeping rates depressed despite the tight capacity tag.
California’s produce lanes are frozen. For the third consecutive week, every California produce lane — Imperial/Coachella, Kern, Oxnard, Santa Maria, and South/Central districts — posted exactly 0% change on lettuce, broccoli, cauliflower, carrots, strawberries, berries, and leafy greens to Baltimore and Philadelphia ($7,500–$8,400 range). California citrus (blood oranges, grapefruit, lemons, oranges, tangelos) reversed last week’s gains, softening -1% to -5% on Atlanta, Baltimore, Chicago, and Dallas lanes. The Yuma-to-Salinas lettuce transition in roughly three weeks is the likely catalyst that breaks this flatline. Colorado potatoes, New York apples, and Washington apples/pears all remain Adequate and largely unchanged.
What to watch: South Texas rates have compounded for three straight weeks with no signs of easing. If you’re a carrier, that’s where the pricing power is. If you’re a broker, update your rate benchmarks — quoting off numbers from even two weeks ago puts you underwater on border lanes. The spring produce season is fully underway, and the tightening is concentrated where the import volumes are building fastest.
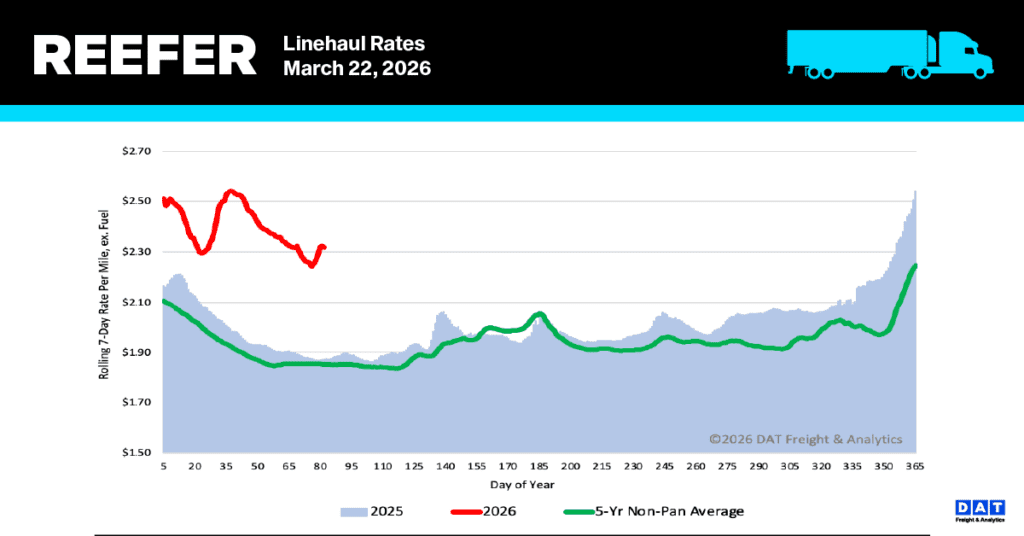
National reefer linehaul spot rates
After five weeks of sharp declines totaling $0.25 per mile, the national average reefer spot rate (excluding fuel) finally saw a halt in its drop, increasing by $0.02 per mile. This stabilization in linehaul rates, mirroring the trend for dry van carriers, suggests that reefer carriers may finally be making headway in recovering from a period where they struggled to fully offset the escalating cost of diesel. Previously, carriers were, on average, only able to incorporate less than 50% of the rising diesel cost into their negotiated load rates.
The average reefer linehaul rate currently stands at $2.32 per mile, which is substantially elevated compared to historical figures. This rate is $0.45 per mile higher (a 24% increase) than the rate recorded during the same timeframe last year. Furthermore, it surpasses the five-year average by $0.44 (19%), excluding the unusually high rates of 2021 and 2022.
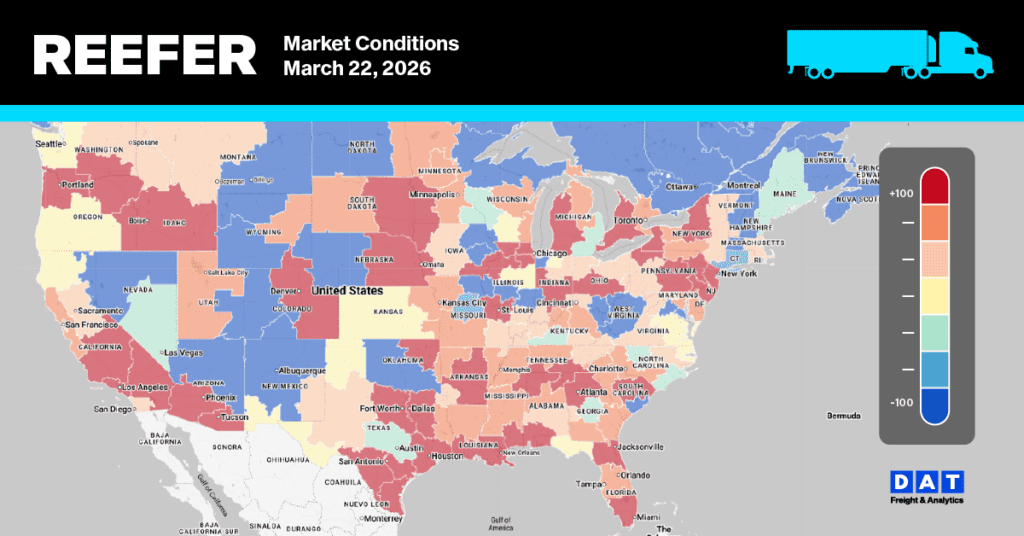
Reefer Market Conditions
The reefer load-to-truck ratio surged by 38% to 21.38, driven by a dramatic 24% spike in load posts last week. This increase is more than double the volume recorded a year ago. Compounding the market tightness was an 11% decline in available reefer equipment posts.
Source: DAT RateView and USDA AMS Specialty Crops National Truck Rate Report, February 18, 2026. Rates represent open (spot) market per-load prices including broker fees for 48–53 ft. refrigerated trailers of produce from the major growing regions to ten destination cities, including Atlanta, Baltimore, Boston, Chicago, Dallas, Los Angeles, Miami, New York, Philadelphia, and Seattle. Week-over-week changes measured against February 10, 2026 report.


