Sweet potatoes are a versatile and popular crop, especially during the American fall and winter holidays. The harvest season typically runs from late summer through fall, usually peaking in September and October. North Carolina is the undisputed leader in U.S. sweet potato production, with Sampson County in the Charlotte freight market being a major hub. The state consistently produces over one billion pounds of sweet potatoes annually. For example, according to the USDA in 2024, North Carolina produced 1.83 billion pounds, equivalent to 915,000 tons or just under 46,000 truckloads. This accounts for a majority of the entire U.S. sweet potato supply.
Get the clearest, most accurate view of the truckload marketplace with data from DAT iQ.
Tune into DAT iQ Live, live on YouTube or LinkedIn, 10am ET every Tuesday.
This concentrated production significantly impacts the refrigerated (reefer) freight market. As the harvest increases, so does the demand for reefers to transport the perishable crop. This surge in demand, coupled with the need for specialized equipment, often leads to higher spot rates and tighter capacity for reefer trucks originating from these key growing regions.
The approaching Thanksgiving holiday further intensifies demand for sweet potato transportation. As a holiday staple, sweet potatoes create a substantial pre-holiday rush to stock grocery store shelves, directly translating into a sharp increase in truckload demand, particularly for reefers, in the weeks leading up to Thanksgiving. Carriers often reposition their fleets to leverage these higher-paying holiday routes, which can draw capacity from other markets and cause widespread rate increases and service disruptions across various sectors. For shippers, understanding these seasonal patterns is crucial for effective transportation planning and budgeting.
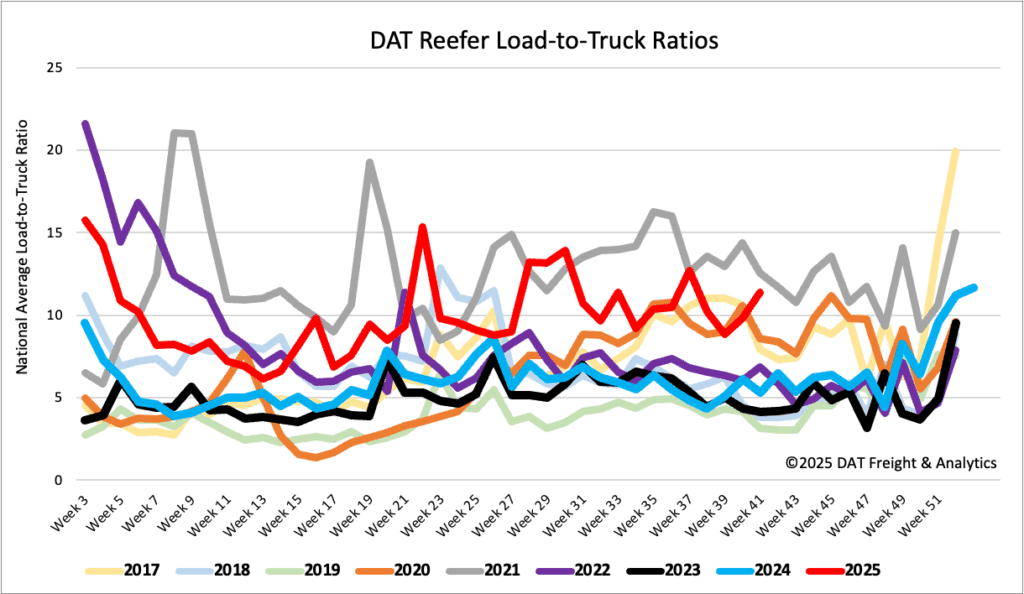
Load-to-Truck Ratio
Reefer load post volumes saw a 2% increase last week, leading to a significant 35% rise year-over-year. Despite this growth, volumes remained consistent with the pre-pandemic average for Week 38. The end of the month brought tighter reefer capacity, evidenced by a 12% decrease in equipment posts and a higher reefer load-to-truck ratio of 11.39.
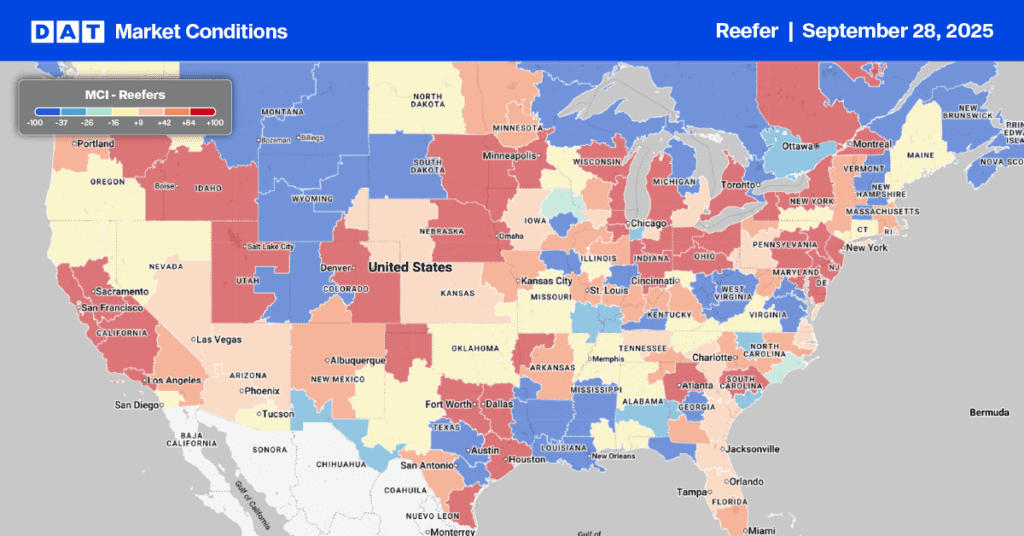
Allentown experienced very tight capacity last week, with an 11% increase in load posts and an average spot rate of $2.09 per mile for outbound loads. The load-to-truck ratio in Allentown averaged 19.7 for the week, peaking at just under 27 loads per truck last Friday. Capacity was particularly constrained on the regional lane to Boston, where reefer spot rates jumped $0.14 per mile to $4.07 per mile last week.
Spot rates
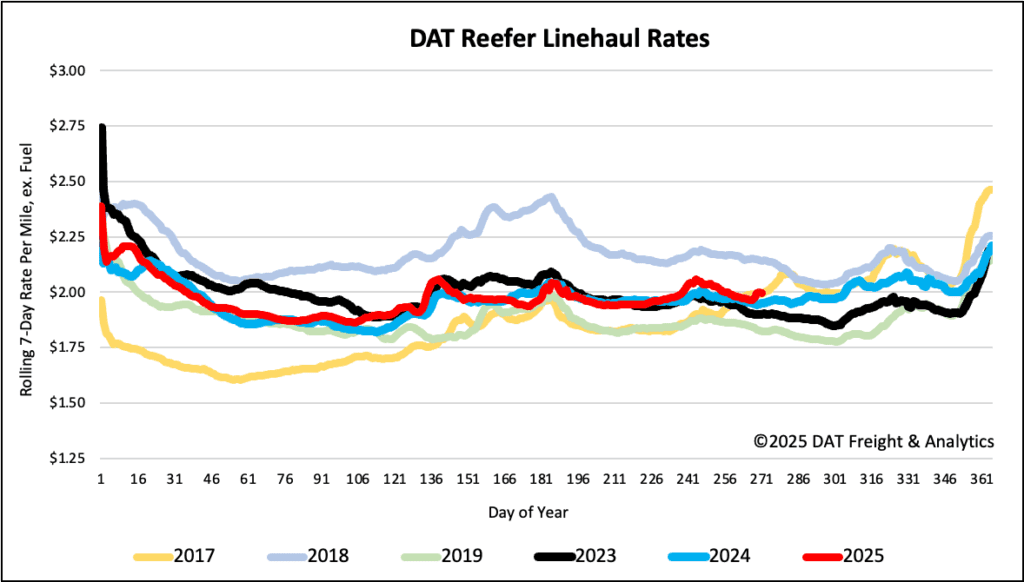
Nationally for all reefer temperature zones, the 7-day rolling average for carriers increased a penny per mile to $2.01 per mile at month end, marking a $0.04 increase compared to the previous year.
The USDA reported an adequate supply of trucks in all 13 growing regions last week. For all produce-specific loads, the USDA reported an average rate of $3.70 per mile, down $0.02/mile last week, but around $0.15 per mile higher than last year for the week ending September 23, 2025.