Watermelon season in the U.S. generally runs from late spring through early fall, with regional variations that extend the availability almost year-round thanks to different growing areas and imports. Watermelons are grown in many parts of the United States, with production concentrated in warm-weather states due to the crop’s need for a long, hot growing season. The top watermelon-producing states in the South and Southwest are Florida, Texas, and Georgia, with Florida leading the nation by a significant margin. California is also a major producer, though it is typically classified as part of the West rather than the South or Southwest.
Get the clearest, most accurate view of the truckload marketplace with data from DAT iQ.
Tune into DAT iQ Live, live on YouTube or LinkedIn, 10am ET every Tuesday.
Watermelon season in the U.S. generally runs from late spring through early fall, with regional variations that extend the availability almost year-round thanks to different growing areas and imports. Watermelons are grown in many parts of the United States, with production concentrated in warm-weather states due to the crop’s need for a long, hot growing season. The top watermelon-producing states in the South and Southwest are Florida, Texas, and Georgia, with Florida leading the nation by a significant margin. California is also a major producer, though it is typically classified as part of the West rather than the South or Southwest.
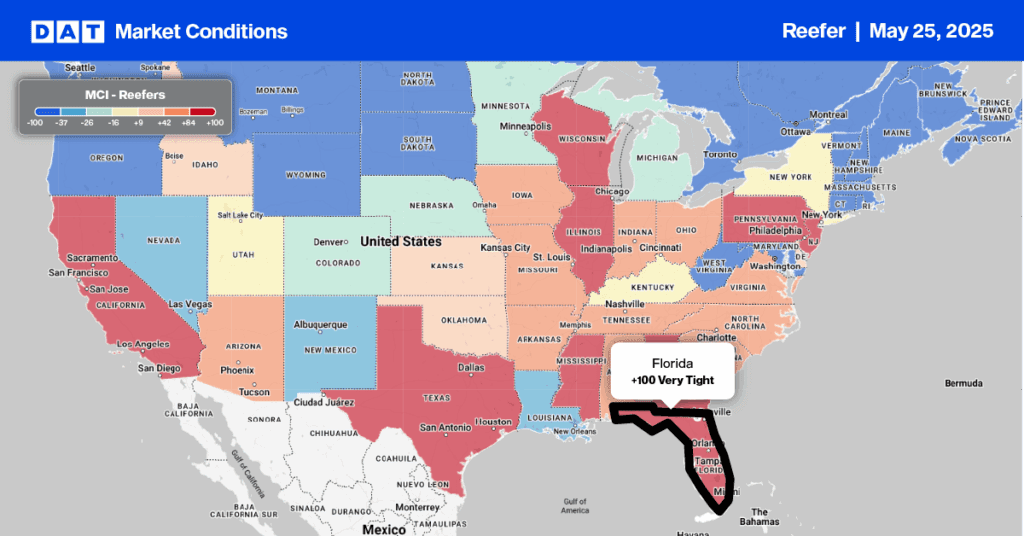
Florida is the largest producer of early-season melons with early harvest beginning in April and ending in July (earliest harvest). According to USDA data, last week there was a shortage of reefer capacity for loads to Boston and New York from the Central and South Florida regions.
Fun facts:
- Watermelon is made up of about 92% water, making it excellent for hydration.
- It is one of the few foods classified as both a fruit and a vegetable.
- There are more than 1,200 varieties of watermelon grown worldwide.
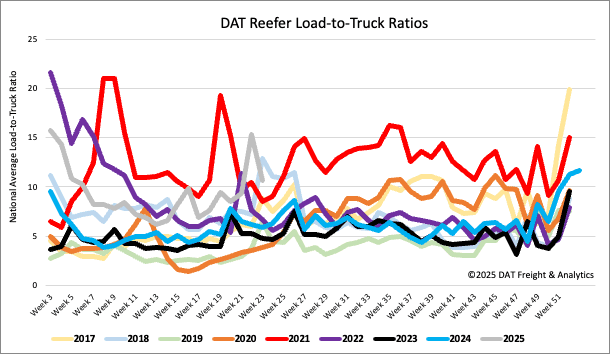
Load-to-Truck Ratio
Reefer load post volumes decreased by 25% last week, offsetting the previous week’s surge before Memorial Day. Simultaneously, reefer equipment posts rose by 5% week-over-week. Consequently, the reefer load-to-truck ratio (LTR) fell by 31% to 10.65, reaching its second-highest Week 21 value in nine years.
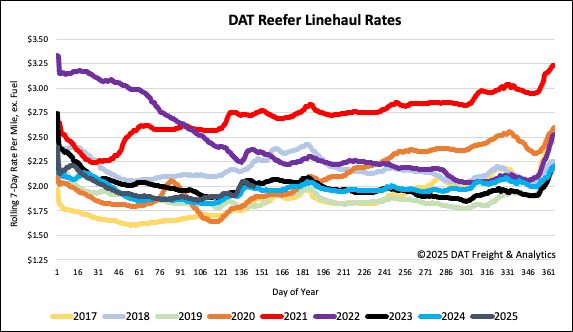
Spot rates
Last week, reefer spot rates experienced the largest decline of the three equipment types, falling by $0.03/mile after the Roadcheck Week-induced capacity tightening of the previous week. Currently at $2.02 per mile, reefer spot rates are up $0.02/mile compared to last year but down $0.04/mile from 2023.