A contributing factor to lower truckload volumes this year, along with the trade war and economic uncertainty, is the longer-term shift in consumer spending. Truckloads of produce have been declining in recent years and recently, Del Monte Foods declared bankruptcy citing lower demand for packaged foods, which are down 4-5% in the last two years, according to NielsenIQ.
Get the clearest, most accurate view of the truckload marketplace with data from DAT iQ.
Tune into DAT iQ Live, live on YouTube or LinkedIn, 10am ET every Tuesday.
Part of the equation is the “Ozempic effect”, where GLP-1 medications are significantly reshaping both consumer food habits and industry strategies, driving a marked shift away from high-calorie, processed foods. GLP-1 medication users report reduced appetite, feeling full faster, and less “food noise,” leading to lower consumption of processed foods, sugary drinks, red meat, and snacks, while increasing intake of fruits, vegetables, and water.
This shift is reflected in household grocery spending, which drops an average of 5.5%—up to 9% in higher-income brackets—due to decreased purchases of indulgent items like snacks, baked goods, and alcohol. Food retailers are responding with smaller, healthier product offerings. Given GLP-1 users consume 16–39% less food annually—equating to 320–780 pounds per person—and account for 8–10% of the U.S. population, the result is a potential 2% reduction in national food and beverage truckload volume, or nearly 450,000 fewer truckloads per year.
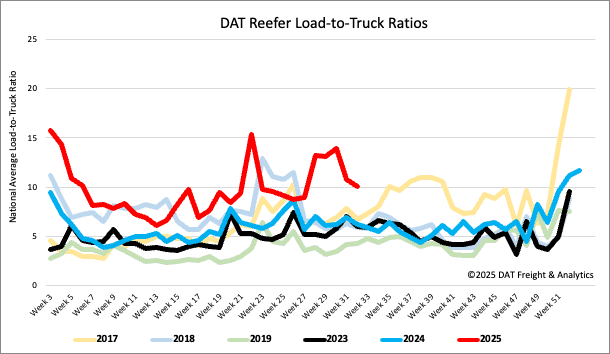
Load-to-Truck Ratio
Last week, the reefer load-to-truck ratio was mostly unchanged at 10.06, following a 20% decrease in reefer load post volumes. Carrier equipment posts decreased by 12%.
Note: To provide a clearer view of seasonal trends, the pandemic-influenced years of 2020, 2021, and 2022 have been excluded.
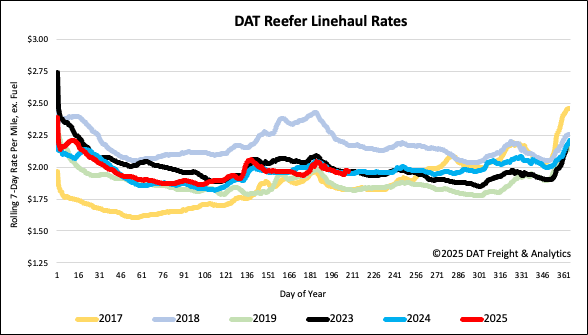
Spot rates
National reefer rates have fallen for the third week in a row, decreasing by $0.01 per mile to just over $1.96 per mile. This rate is $0.02 per mile higher than last year and slightly above 2023 rates.
Note: To provide a clearer view of seasonal trends, the pandemic-influenced years of 2020, 2021, and 2022 have been excluded.