The U.S. cherry season starts in mid-May in California, moving to the Pacific Northwest for its peak from June to July. By early August, the season concludes in the Midwest and Northeast. Sweet cherries are harvested initially, with tart cherries following later. The timing and quantity of the harvest can vary annually due to weather conditions and chill hours.
Get the clearest, most accurate view of the truckload marketplace with data from DAT iQ.
Tune into DAT iQ Live, live on YouTube or LinkedIn, 10am ET every Tuesday.
Americans consume a substantial amount of cherries each year, with the U.S. cherry market generating approximately $17.8 billion in revenue in 2024 and direct consumption (fresh eating) accounting for nearly half of that market. Direct consumption is the largest segment, representing 48.5% of the U.S. cherry market in 2024. This includes fresh cherries eaten out of hand, as opposed to processed forms like jams, juices, or baked goods.
The U.S. is the fourth-largest cherry producer in the world, with production last year totalling 971.7 million pounds according to the USDA or the equivalent of 23,000 refrigerated truckloads.
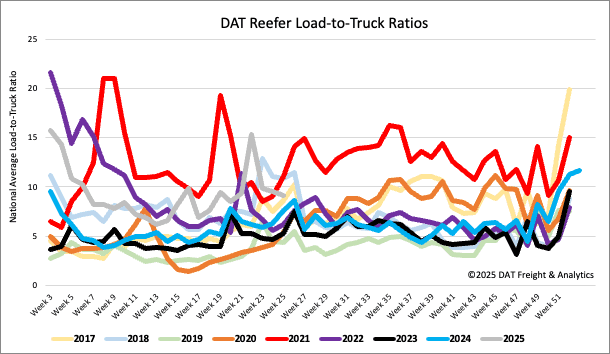
Load-to-Truck Ratio
Reefer load postings fell 4% last week, but volumes are still up 1% year-over-year. Reefer equipment postings remained stable. Consequently, the reefer load-to-truck ratio dipped 5% to 9.10.
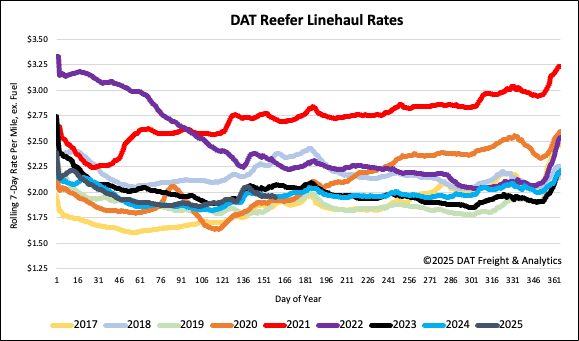
Spot rates
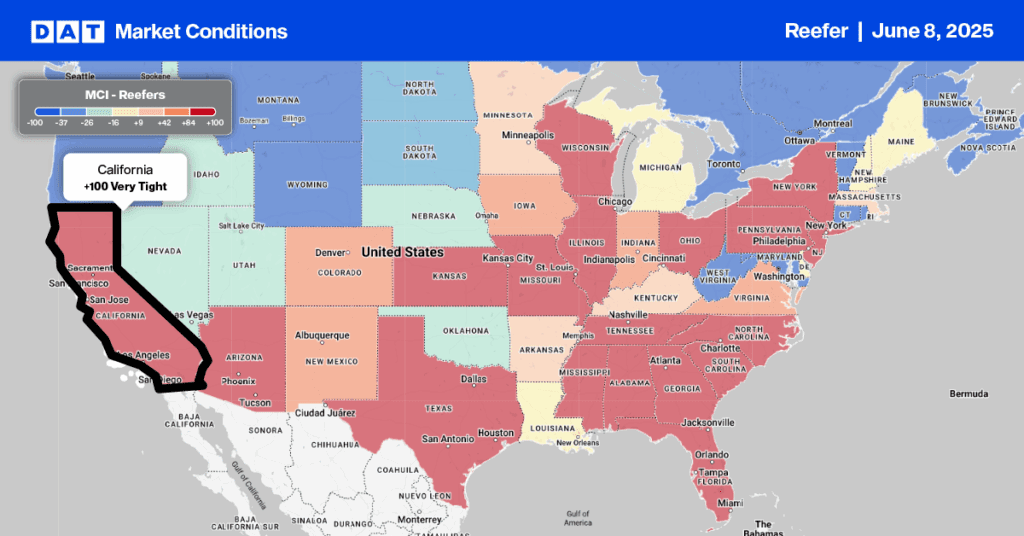
Reefer spot rates held steady last week at $1.97 per mile, after a two-week decline, reflecting this year’s subdued produce season. This rate matches last year’s but falls $0.12 per mile short of 2023 levels. Normally, the four weeks leading up to Independence Day see a surge in produce volumes, but this year starts 19% behind last year’s truckload volumes, with California’s figures lagging 29%.
In 2024, truckload produce volumes jumped 22% in this period, driving reefer spot rates up by $0.08 per mile. Therefore, there is still potential for rates to increase due to produce seasonality. However, this year appears to be experiencing a modest increase rather than a significant spike.