The United States is currently the 7th largest watermelon producer globally. Watermelon is grown in warm regions, spanning from Florida to Guatemala, making it available throughout the year in the United States. Florida, Georgia, Texas, and California are the leading states for domestic watermelon production. The typical growing season is from April to September, with shipping volumes peaking in July and August, coinciding with national watermelon festivals.
Get the clearest, most accurate view of the truckload marketplace with data from DAT iQ.
Tune into DAT iQ Live, live on YouTube or LinkedIn, 10am ET every Tuesday.
In the past 30 days, there has been a significant increase in watermelon tonnage, accounting for 20% of the national volume, surpassing potatoes, tomatoes, and apples. Indiana typically produces the highest volume at this time of year, accounting for almost 30% of truckload volume last week. However, the USDA has reported a shortage of reefer capacity in the Southwest Indiana and Southeast Illinois region over the last month, while growers have found sufficient capacity to move loads in the Southeast. Still, the USDA has reported a reefer capacity shortage in the Southwest Indiana and Southeast Illinois region over the last month.
Market watch
All rates cited below exclude fuel surcharges, and load volume refers to loads moved unless otherwise noted.
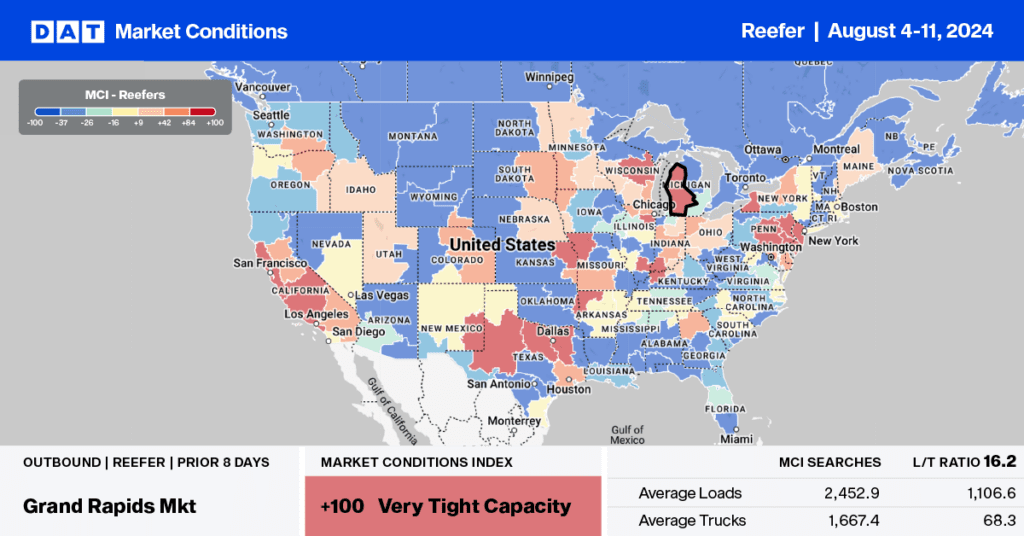
Over 70% of watermelon production in Southwest Indiana and Southeast Illinois is in and around Knox County, Indiana. Most of that production is within 15 miles east and west of a 50-mile corridor running along US Hwy 41 in DAT’s Evansville freight market, our focus market this week. Most of the refrigerated truckload volume is regional, with almost 70% of reefer loads headed to the larger Chicago/Joliet markets to the north, followed by longer-haul loads to Atlanta and Lakeland, FL.
Reefer spot volumes out of the Evansville market have almost doubled in the last month as the market reaches peak shipping volume. Outbound linehaul rates were up $0.07/mile last week to $2.83/mile, $0.22/mile (8%) higher than last year. Last week, capacity was very tight for loads to Atlanta as spot rates increased by $0.13/mile to $3.81/mile on lower volume.
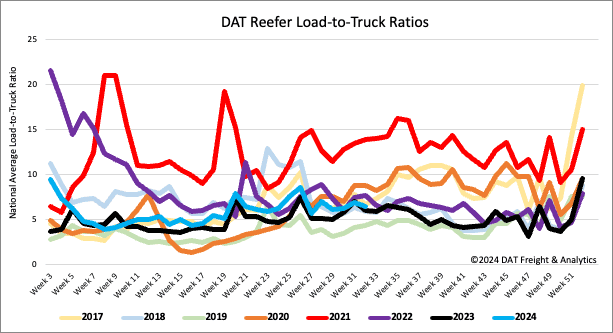
Load-to-Truck Ratio
After being primarily flat for the last three weeks, the volume of reefer load postings decreased by 11% last week and 18% y/y. According to the USDA, truckload produce volumes last week were 7% lower than last year, with California’s volume down 18% yearly. Carrier equipment posts were 3% lower last week and 23% lower year over year, leading to a 7% decrease in the reefer load-to-truck ratio (LTR) to 6.41.
Spot rates
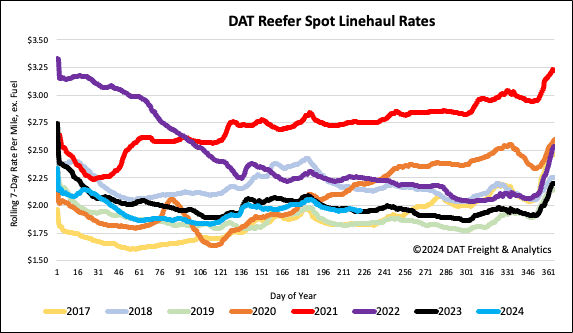
The national average reefer linehaul remained flat last week, averaging $1.97/mile. Reefer spot rates were almost $0.02/mile higher than last year and $0.02/mile lower than the 3-month trailing average.
