Van and reefer rates continue to move sideways. Refrigerated produce freight has been notably absent from the picture, so that likely has some reefers competing for van freight.
There was very little price movement up or down last week and rates — and fuel prices — remain stable.
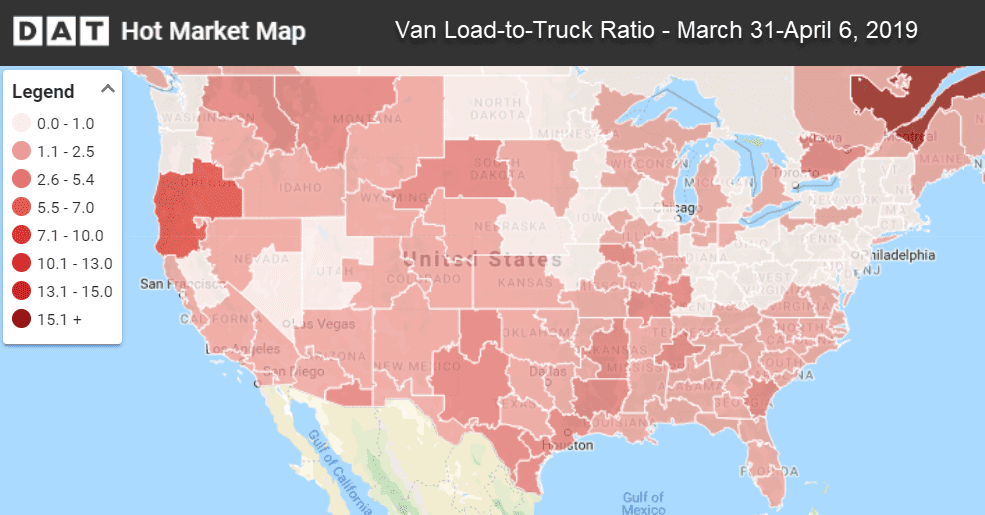
The van load-to-truck ratio declined last week to 1.3 loads per truck.
National Average Freight Rates – April to-date
- Van: $1.86/mile (1¢ higher than the March average)
- Reefer: $2.17/mile (same as the March average)
- Flatbed: $2.40/mile (6¢ higher than March)
VAN TRENDS
Van volumes slipped compared to the previous week, and rates went flat. That isn’t unusual for early April, since there was extra activity in late March for the close of Q1. Van volumes are actually up compared to where they were at this time last year, but that has been met with increased capacity.
In the top 100 lanes last week, just 38 rose, while 58 fell, and 4 were neutral. Two markets slipped more than 2% in price, both in the northeast: Philadelphia and Buffalo.
Rising rates
Los Angeles and Seattle had slight bumps up in pricing, but nothing exceptional. No lanes in the Top 100 rose by more than 10¢ per mile:
- Memphis to Columbus increased 9¢ to $1.96/mi.
- Los Angeles to Atlanta added 8¢ to $1.58/mi.
- Chicago to Allentown, PA gained 7¢ to $2.39/mi.
Falling rates
As we move towards Easter, headhaul lanes will inevitably rise, but right now pricing is slipping from Buffalo and Philadelphia. Just a handful of lanes fell more than 10¢ cents per mile:
- Seattle to Eugene,OR, dropped 15¢ to $2.35/mi.
- Columbus to Memphis fell 14¢ to $1.70/mi.
- Houston to Oklahoma City slipped 12¢ to $1.92/mi.
REEFER TRENDS
Volumes jumped 23% from Miami last week and nearly 9% from Lakeland, but we are still early in spring produce season. Miami absorbed existing capacity while Lakeland rates got a boost. Elsewhere, the border crossing at Nogales, AZ saw volumes increase nearly 20%, and rates went up.
On the top 72 reefer lanes last week, 36 were up, 33 were down, and 3 stayed the same. For the entire U.S., volumes were actually down 1%, but expectations are rising with spring weather. Rates overall are showing more volatility in the reefer space, unlike van.
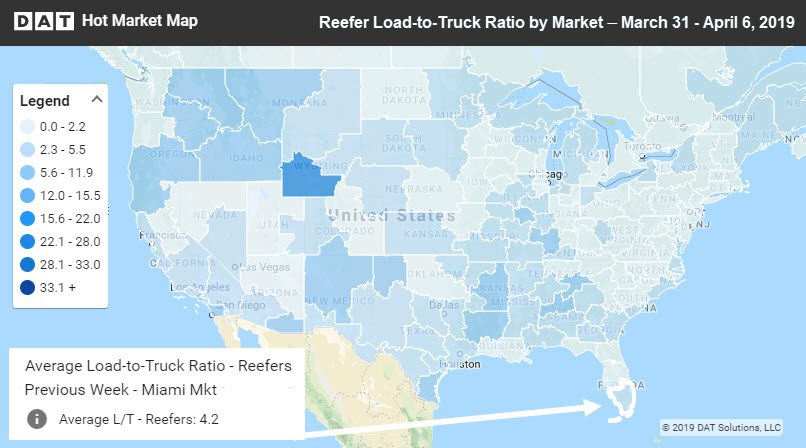
The load-to-truck ratios moved up to 4.2 in the Miami market last week. That’s not a high ratio, but at least loads were moving. That lone dark spot near the center of the map is Green River, Wyoming, where a few dozen load posts overwhelmed an even smaller number of truck posts.
Rising Rates
Fresno volumes were up, but other parts of California went softer. In the Midwest, rates were higher from Chicago and Grand Rapids. Grand Rapids saw rates rise about 5%, which was the biggest rate change for a market.
- Grand Rapids to Atlanta surged 44¢ to $2.95/mi.
- Lakeland to Atlanta jumped 23¢ to $1.66/mi.
- Sacramento to Portland, OR, also gained 23¢ to $2.93/mi.
Falling rates
- Elizabeth, NJ to Atlanta fell 20¢ to $1.69/mi.
- Atlanta to Lakeland declined 15¢ to $2.74/mi.
- Fresno to Seattle lost 18¢ to $2.36/mi.
Find loads, trucks and lane-by-lane rate information in DAT load boards, including rates from DAT RateView.


