The alcohol industry produces an estimated 20,000 truckload equivalents each week, hauled mainly by truckload carriers, but it has yet to be all froth and bubbles for beverage makers. The world’s largest brewer, AB InBev, reported a fall in sales volume at the end of last year as steep price increases prompted a drop in demand for beer in the U.S. That trend may be turning around, though, as American beer drinkers get passed their sticker shock and we head into the first of two shipping peaks on the freight calendar. March is typically when beer production improves, driven by restocking from the February inventory drawdown and higher demand around St Patrick’s Day and Spring Break.
Truckload carriers in this sector generally see a bump in freight volumes in March and then again in June at the height of summer festivities, with the latest National Beer Wholesalers Association (NBWA) Beer Purchasers’ Index (BPI) reporting good news. According to the NBWA, “the February BPI shows a potential shift towards a more positive outlook for the beer industry in 2023. For most of 2022, beer distributors were cautious concerning their beer purchases, recording six out of twelve months with below 50 BPI index readings and above 50 ARI (at-risk inventory) readings—indicating too much inventory in distributor warehouses. The February results reflect a BPI of 54 and an ARI of 46. After two disruptive years in 2021 and 2022, this is positive news for the beer industry”.
The NBWA surveys beer distributors’ purchases across different segments and compares them to previous years’ purchases. A reading greater than 50 indicates the segment is expanding, while a reading below 50 indicates the segment is contracting.
Market Watch
All rates cited below exclude fuel surcharges unless otherwise noted.
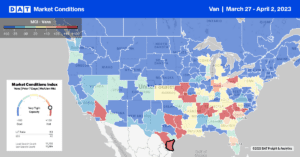
At $1.13/mile excluding fuel, outbound dry van rates in Florida at $1.13/mile were identical to 2019 last week, although spot market volumes increased 3% w/w. In nearby Alabama and Louisana, rates were up a penny per mile last week at $1.74/mile and $1.73/mile, respectively. Except for the smaller New Hampshire market, where rates jumped by $0.13/mile to $1.90/mile, all other east coast markets reported lower spot rates last week.
Along the southern border in Texas, dry van capacity tightened slightly following last week’s $0.01/mile increase to $1.77/mile for outbound loads. In the larger Laredo market, the number one commercial crossing market for imports, volumes increased by 9% w/w, pushing up spot rates to $1.87/mile. Laredo to Ontario, CA, was a popular lane last week with $1.62/mile rates, ending March at $0.14/mile over the prior month. In the Pacific Northwest, Seattle outbound rates increased by $0.03/mile last week to $1.22/mile following an 18% w/w increase in load posts.
Load-to-Truck Ratio (LTR)
The typical end-of-month and quarter shipping surge materialized following last week’s 6% w/w increase. Volumes are still around half what they were the previous year and very close to 2017 levels as we end the first quarter. A 2% w/w decrease in equipment posts resulted in the dry van load-to-truck ratio (LTR) increasing by 8% w/w from 1.87 to 2.01.


