Truckload capacity remains tight, but not why you think. All shippers have been experiencing supply chain disruptions and labor shortages, which have manifested themselves in lower on-time rates and acceptance ratios along with higher spot rate usage and rates. Yet when we look at demand using the MSU for-hire truck transportation index, freight demand in 2021 was 1% below 2018 levels and similar to 2019, according to Assoc Prof. Jason Miller at Michigan State University’s Eli Broad College of Business.
Even within DAT’s freight network representing around $120 billion in annual freight spend, the volume of loads moved (as opposed to loadboard posts) was relatively flat in 2021, decreasing by less than 1% y/y. Under the covers, there was, however, a substantial shift in how freight was moved. Loads moved under contract rates in 2021 dropped by 12.44% y/y while loads moved on the spot market increased by 12.72% y/y.
“Shippers are likely to remember 2021 as the year with the tightest trucking capacity they’ve encountered in a long time,” Miller said in a recent guest blog for C.H. Robinson “This seemed to contradict the typical supply and demand equation. In parallel, there’s some evidence that when the number of self-employed owner-operators is considered in addition to employment statistics, the number of for-hire truck drivers is above pre-COVID levels.”
With less or similar demand and more supply than the pandemic, Prof. Miller suggests that tight truckload capacity is driven by two supply-side factors – “First, the upheaval caused by the pandemic is far more extreme than it appeared and second, the surge of new truck establishments creates its open kind of disruption.” DAT has seen a doubling of freight volumes in the spot market, where many new entrants geared up with digital technology have been able to take advantage of record-high spots rates and record one of their best years on record. From a freight- and rates-fundamentals perspective, Todd Amen, CEO of ATBS described the current market as, “the best trucking environment that I’ve ever seen in 30-plus years.”
There are signs the freight market is cooling as we begin March, and in a reversal of what we’d typically expect at the end of a shipping month, the volume of loads moving in DAT’s freight network dropped 1% w/w. Load posts on DAT’s loadboard also dropped by 5% w/w and are now down by 10% m/m.
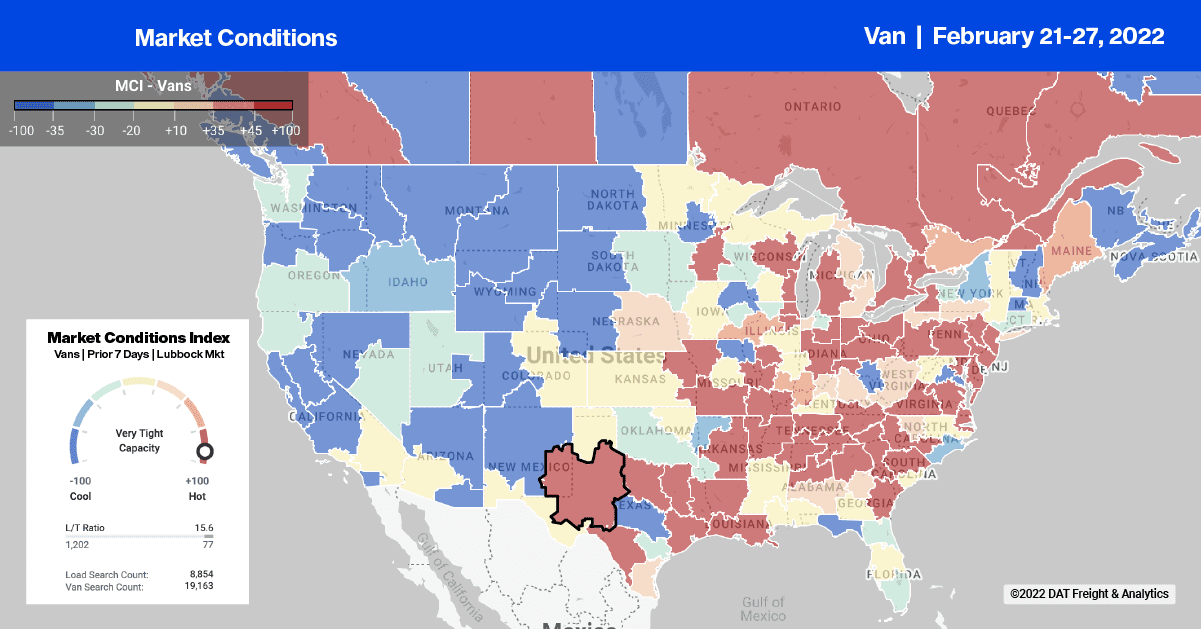
Truckload capacity in the Colorado markets of Grand Junction and Denver tightened rapidly last week – spot rates increased $0.04/mile to an average of $1.65/mile excl. FSC after dropping for the three prior weeks. In the last week, Colorado has been pounded by snow, making travel across 1-70 through the Rockies treacherous for truckers. In contrast, last Tuesday Denver made weather history as the coldest high temperature the city has ever had on Feb. 22, beating out a 109-year-old record. After averaging $1.35/mile excl. FSC for all of last year, spot rates last week jumped to an average of $1.90/mile excl. FSC for loads from Denver to Los Angeles
On the East Coast in Charleston, WV, capacity also tightened last week following a 21% w/w increase in load post volumes after decreasing over the prior four weeks. Spot rates jumped by $0.27/mile to an average outbound rate of $3.23/mile excl. FSC last week. Loads from Charleston to Columbus hit a new 12-month high at $6.02/mile excl. FSC last week, which is around $0.90/mile higher than the previous year.
After making news most of last year, spot rates on the high-volume Los Angeles to Chicago lane plummeted last week to an average of $2.48/mile excl. FSC. That’s still $0.53/mile higher y/y but a long way south of the high of $3.28/mile excl. FSC that was recorded in December.
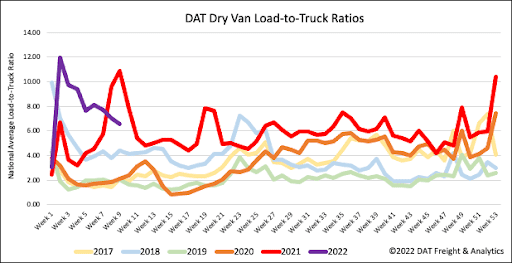
Dry van load post volumes dropped for the third week in a row and are now 30% lower than the previous year but remarkably double the same week in 2018. Carrier equipment posts have been relatively flat over the last three weeks resulting in the dry van load-to-truck (LTR) ratio continuing to slide. Last week the LTR decreased 7% w/w from 7.04 to 6.54.
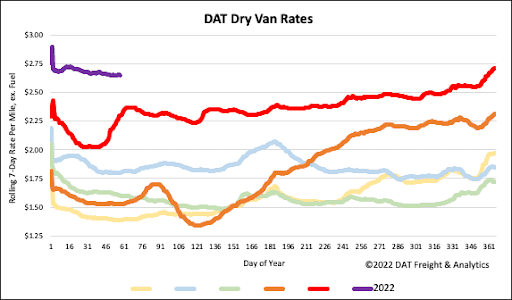
Spot market capacity continues to loosen slowly, with spot rates now down for the sixth week in a row following last week’s $0.03/mile decrease in rates. The dry van national average ended the week at $2.65/mile excl. FSC is still $0.35/mile higher than the previous year and $0.85/mile higher than the same week in 2018.


