February’s overall Logistics Managers Index (LMI) reading of 75.2 is the second-highest in the history of the index and offers a glimpse into what future demand could look like for the dry van market.
“January’s 3.3% sequential gain makes it 13 consecutive months over 70.0, which we would classify as significant expansion, with no obvious signs of a slowdown on the horizon,” according to Zac Rogers, Assistant Professor at Colorado State University. “Like January, this month’s growth is driven by rapid growth in Inventory Levels, which are up 9.1 points to 80.2 – crossing the 80.0 threshold for the first time and shattering the previous record of 72.6. This was a complete 180 from the Fall of 2021 when firms struggled to build up inventories.”
The inventory build appears to be a combination of over-ordering to avoid shortages, late-arriving goods due to supply chain congestion, and a softening of consumer spending created a logjam. The LMI report noted that inventory levels were higher in February than in November last year. We could be seeing a further cooling in demand for dry van carriers as inventories reach peak levels. “Firms will now have to decide what to do with this unseasonably high inventory. Will they be sold at a discount or stored in increasingly expensive warehouses and backrooms? Neither option is ideal, and it will be fascinating to observe the different strategies that are deployed over the coming months”, Rogers said.
News of China’s largest city and port going into lockdown will have long-lasting consequences for U.S. imports for the rest of this year. Supply chain disruptions will likely result in more port market volatility at larger ports, including the Ports of Los Angeles and Long Beach. Import volumes are down 7% y/y nationally and 11% y/y along the West Coast, where 46% of all loaded containers come from China.
In the Los Angeles freight market, load post volumes were down 12% last week, with outbound spot rates continuing to slide after dropping another $0.07/mile last week to an average of $2.42/mile excl. FSC. Rates are now down by $0.35/mile in the last month, and on the high-volume lane to Chicago, spot rates have plunged by $1.24/mile since December to an average of $2.05/mile excl. FSC this week – that’s almost $0.40/mile lower than the previous year. Loads west to Dallas have been following a similar pattern averaging $2.03/mile excl. FSC this week after being as high as $3.60/mile last November.
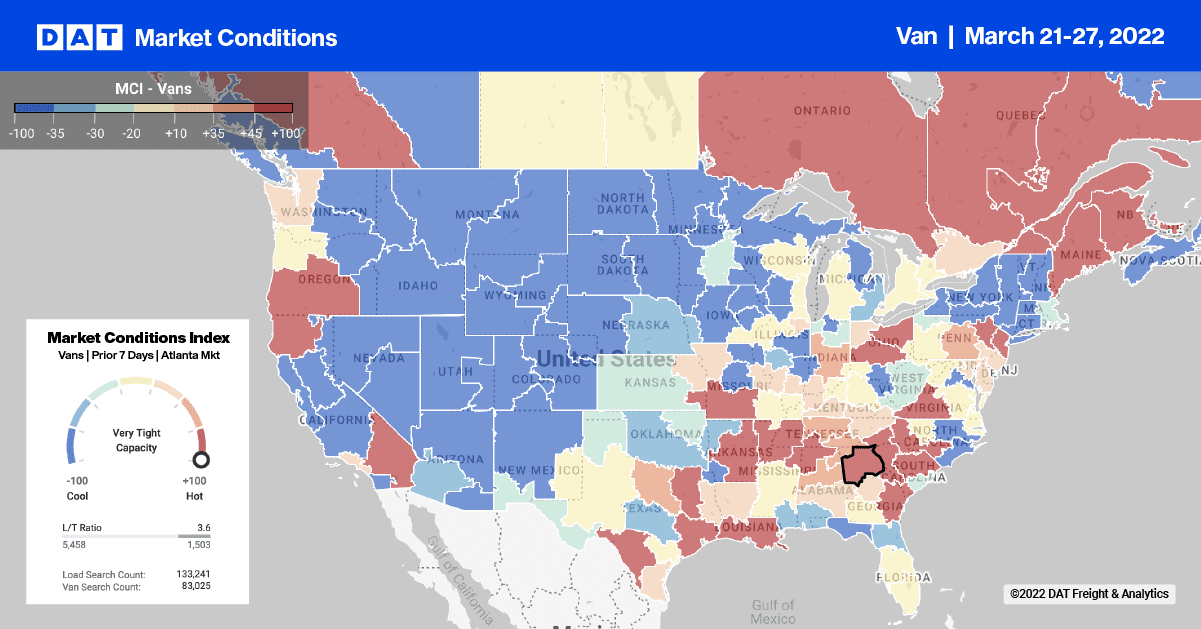
In Upstate New York in the Finger Lakes Region, capacity tightened last week as rates increased by $0.03/mile to an average outbound rate of $2.81/mile excl. FSC, while in nearby Augusta, ME, rates increased by almost the same amount to an average of $2.65/mile excl. FSC. Loads from Elizabeth, NJ, to Chicago are now $0.07/mile lower at $1.91/mile excl. FSC compared to this time last year with loads south to Atlanta paying $2.28/mile excl. FSC or about the same as the previous year.
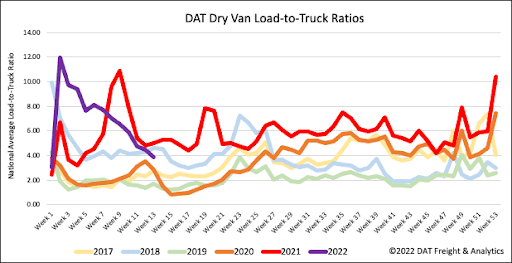
Dry van load post volumes continue to slide down another 12% w/w, making load post volumes 30% lower compared to the previous month. Carrier equipment posts remained flat again, resulting in the dry van load-to-truck (LTR) ratio decreasing by 4% w/w from 4.44 to 3.87.
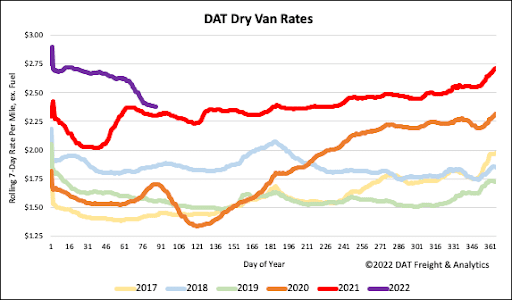
Spot market capacity continues to loosen rapidly, with spot rates now down $0.27/mile in the last four weeks following last week’s decrease of $0.04/mile. The dry van national average is $2.39/mile excl. FSC is now just $0.07/mile higher than the previous year.


