Lower than-forecast diesel prices by The Energy Information Administration (EIA) provide truckload carriers with breathing room as we head into the summer. As spot rates continue to bounce along what appears to be the bottom of the current freight cycle, now over 24 months, lower fuel costs are most welcome. Even though dry van spot rates hover at $0.05/mile above 2019, a notoriously poor year for truckers, operating costs are around $0.16/mile or 10% higher in 2024. The margin squeeze is felt by owner-operators and small fleets, resulting in many either parking up on the sidelines until the market improves or exiting the market entirely.
Get the clearest, most accurate view of the truckload marketplace with data from DAT iQ.
Tune into DAT iQ Live, live on YouTube or LinkedIn, 10am ET every Tuesday.
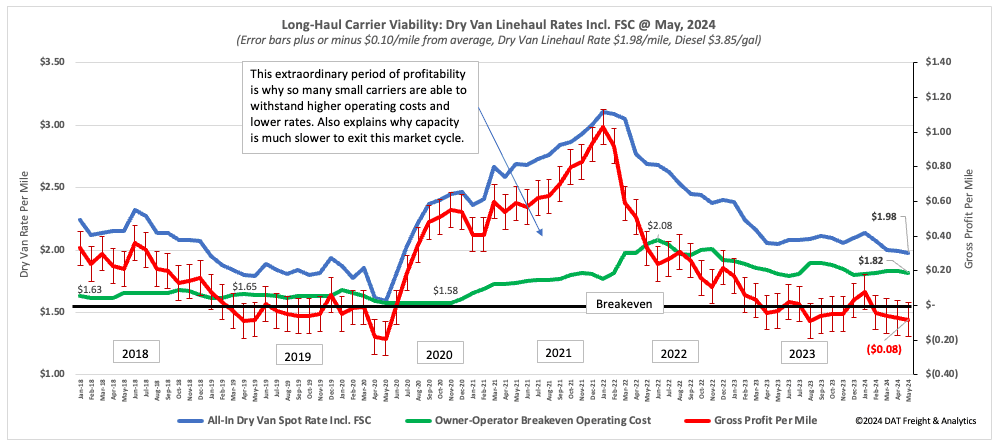
Average operating costs for a long-haul interstate carrier were $1.82/mile at the end of May compared to $1.86/mile a year ago. Operational costs are based on dry van rates, including the fuel surcharge at $1.98/mile, diesel at a national average of $3.85/gal, and driver wages at $60,000/year. 2019 was a challenging year for the trucking industry, especially small carriers, and based on current market dynamics, spot market carriers are starting to operate well into the red as they did in 2019. It was also a year characterized by a non-existent peak season, softening spot rates, and an oversupplied market, which mirrors the current state of the 2024 freight market. At $1.82/mile, estimated profit margins for the small fleet are identical to May 2019.
Figure 1: Estimated Long-Haul Carrier Operating Costs
Market watch
All rates cited below exclude fuel surcharges, and load volume refers to loads moved unless otherwise noted.
Truckload capacity tightened slightly across major markets last week as loads moved jumped by 31% w/w nationally. In the Top 5 states for spot market volume, California, Texas, Georgia, Illinois, and New Jersey, rates were up $0.03/mile on a 27% higher volume. Impacted by 9% higher import volume than last year in the Port of Los Angeles, loads moved increased 22% w/w, pushing up outbound linehaul rates by $0.04/mile to $2.19/mile. A similar trend was reported in nearby Ontario, where linehaul rates averaged $2.28/mile on a 14% higher volume.
Atlanta volume increased 26% w/w, driving up linehaul rates for outbound loads by $0.04/mile to $2.01/mile. In Dallas, volumes were 32% higher w/w, with average outbound rates up $0.04/mile to $1.60/mile. Chicago outbound volumes were up 25% w/w, with spot rates up $0.05/mile to $1.96/mile.
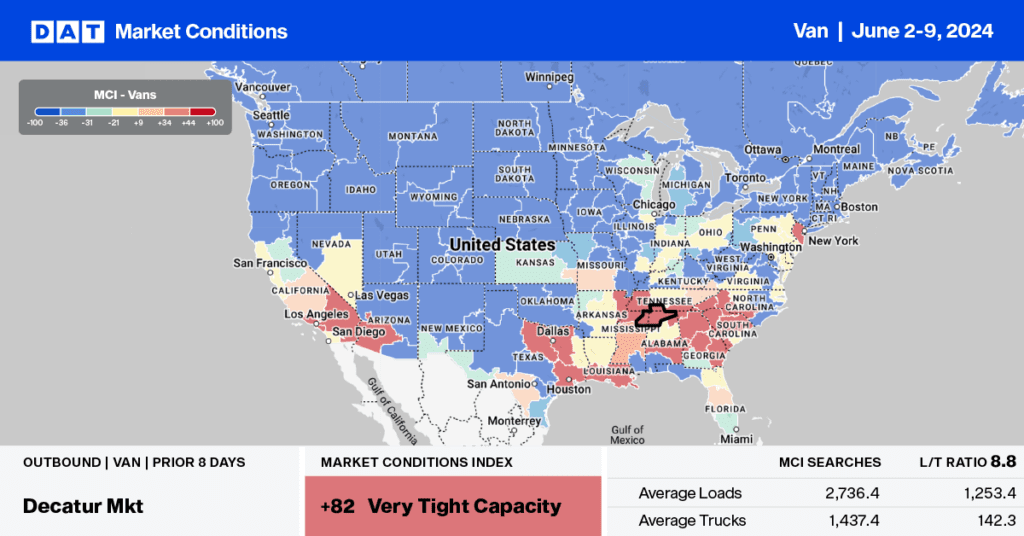
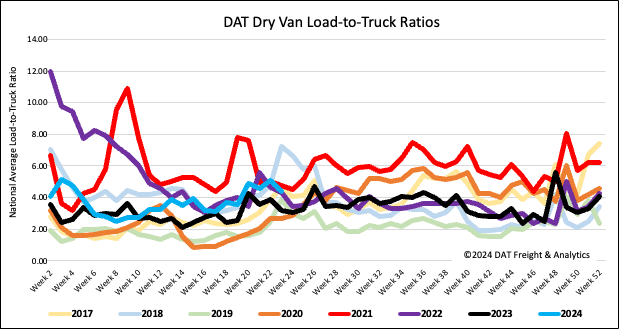
Load-to-Truck Ratio
Dry van load post volume remained within 3% of last year following last week’s 2% w/w decrease in the first shipping week of June. Carrier equipment posts were 24% higher as carriers returned to the market after the Memorial Day break, decreasing the dry van load-to-truck ratio by 14% w/w to 4.38.
Linehaul spot rates
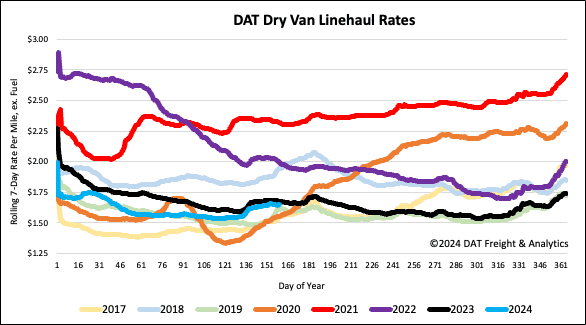
The national average dry van linehaul rate was primarily flat last week as carriers returned to the market in full force. At $1.66/mile, linehaul rates are $0.02/mile lower y/y on a 9% higher volume of loads moved in Week 23. DAT’s Top 50 lanes, based on the volume of loads moved, averaged $2.01/mile last week, 0.35/mile higher than the national average.