The Logistics Managers’ Index grew in September but decelerated in recent months. The index came in at 61.4 in September, up 1.7 from August’s 59.7. The growth is due to expansion in inventories, utilization of warehousing and transportation, and related costs. Every metric except Transportation Prices and Warehousing Capacity grew.
The Inventory Level value is 71.9, up 4.3 from August’s reading of 67.6. This reading is down 8.3 from the index’s all-time highest value in February but is still 13.3 points higher than last year, and 10.5 points higher than two years ago. Inventory levels remain pretty high, with retailer excess inventory still playing a role; however, respondents feel the growth will decline in the future. The current Inventory Costs index of 77.2 is an increase (+0.4) from August’s reading of 76.8 and represents a stabilization after a recent downward trend.
Given the high Inventory Levels index value, it is not surprising that Inventory Costs remain high. “Inventory is everywhere. It’s permeating warehousing networks, which means inventory costs are high,” said LMI researcher Zac Rogers, assistant professor of supply chain management at Colorado State University. “[The situation] is driving up warehousing prices and utilization.”
The Warehousing Capacity index registered at 44.3 points this month, a 2.1-point increase from the month prior, and is down 3.6 points y/y. The contraction in capacity has been ongoing for over two years, with demand outpacing supply. The Warehousing Utilization index registered at 76.8, reflecting an 11.5-point increase from the month prior and a 10.4-point increase y/y. This reading and the continued tightening in the capacity could be indicative of the glut in inventory reported across numerous industries.
The Transportation Capacity Index registered at 71.8. This reading is an increase of 7.5 points from the August reading of 64.3 and is a 50.0-point increase from the reading two years ago of 23.8, which was experienced when supply chains were dealing with the COVID lockdowns. The Transportation Utilization Index registered 61.1 percent in September 2022. This reading is a sharp increase of 9.5 points from the 51.6 recorded in August. Finally, the Transportation Prices Index read in at 44.5, declining -3.5 points from August’s reading of 48.0. Although transportation Prices and Utilization generally trend together, this may be representative of the push to cut costs, potentially by combining loads as much as possible.
“Everyone is trying to cut costs … but also, businesses learned lessons during the pandemic–especially due to the tightness in the supply chain of the past couple of years,” Rogers said. “Now, they want to be as efficient as possible.”
All rates cited below exclude fuel surcharges unless otherwise noted.
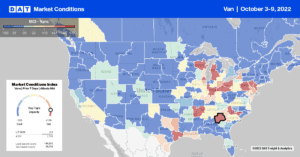
Much activity was focused on the Southeast last week as the rebuilding effort began following Hurricane Ian. After being staged in markets just north of Florida the week prior, inbound load post volumes into Florida’s four freight markets increased by 27% last week. In the hardest hit market in Lakeland, inbound load posts increased by almost 34% w/w. Linehaul rates increased by $0.03/mile to an average of $1.23/mile for all Florida outbound loads driven primarily by a 25% w/w increase in outbound load posts in Lakeland, the largest of the four Florida markets.
A significant volume of inbound loads to Lakeland originated in Atlanta following a 42% w/w increase in loads moved on that lane. Linehaul rates on that lane at $3.03/mile are currently $0.18/mile higher than the September monthly average. Other inbound lanes reporting gains include Charlotte, NC, to Lakeland where spot rates averaged $2.83/mile last week, $0.24/mile higher than the prior month’s average after being flat since May this year. As expected capacity tightened in the Southeast’s major distribution market in Atlanta, outbound spot rates increased $0.07/mile to an average of $1.87/mile. A similar trend was reported in nearby Savannah.
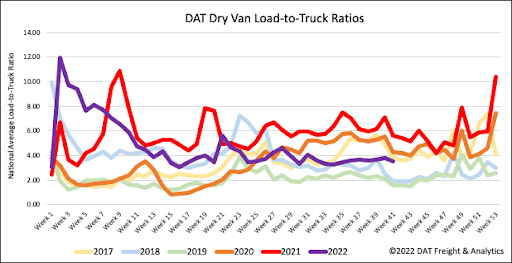
Load posts still exceeded one million for the fourth week in a row despite last week’s 2% decrease. Volumes had averaged 1.2m load posts per week since June 2020, when the post-pandemic economic recovery began in the freight market, and were only lower than one million per week in 15 of 123 weeks. Compared to the average weekly load posts prior to the pandemic of 612,643 per week going back to 2016, the post-pandemic weekly average is just over double. Equipment posts increased by 5% last week as more capacity continues to enter the market and are now just 2% below 2019 levels when the market was oversupplied. As a result of fewer load posts and more equipment posts last week, the dry van load-to-truck ratio (LTR) decreased slightly from 3.77 to 3.51.
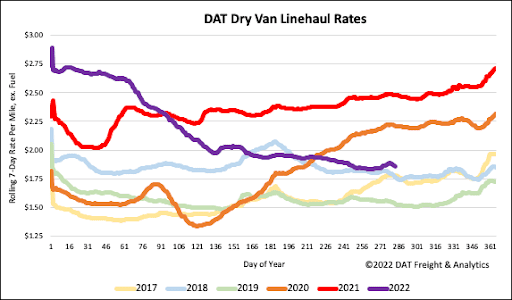
Even though load posts into Florida were up by 27% last week, it was insufficient to alter the previous week’s linehaul spot rates, which mainly remained flat at $1.88/mile. Compared to the top 50 dry van lanes, which averaged $2.23/mile the previous week, the national average was $0.35/mile lower. Even though dry van spot rates are $0.62/mile lower than the last year, they are still $0.22/mile higher than the average of the prior four pre-pandemic years for the beginning of October.


