Last week’s industrial production results published by the Federal Reserve reported a 0.4% increase in November. Production has been steadily improving after dropping 16.5% in March and is now around 5% below its pre-pandemic (February) reading, still down 5.5% y/y. In the manufacturing sector, the biggest component of industrial production, increased 0.8% in November for its seventh consecutive monthly gain.
Contributing significantly to the increase in factory production was motor vehicles and parts production, which increased 5.3% m/m as the nation’s automotive and parts plants increased production, which in turn creates demand for dry van freight.
Find van loads and trucks on the largest on-demand freight network in North America.

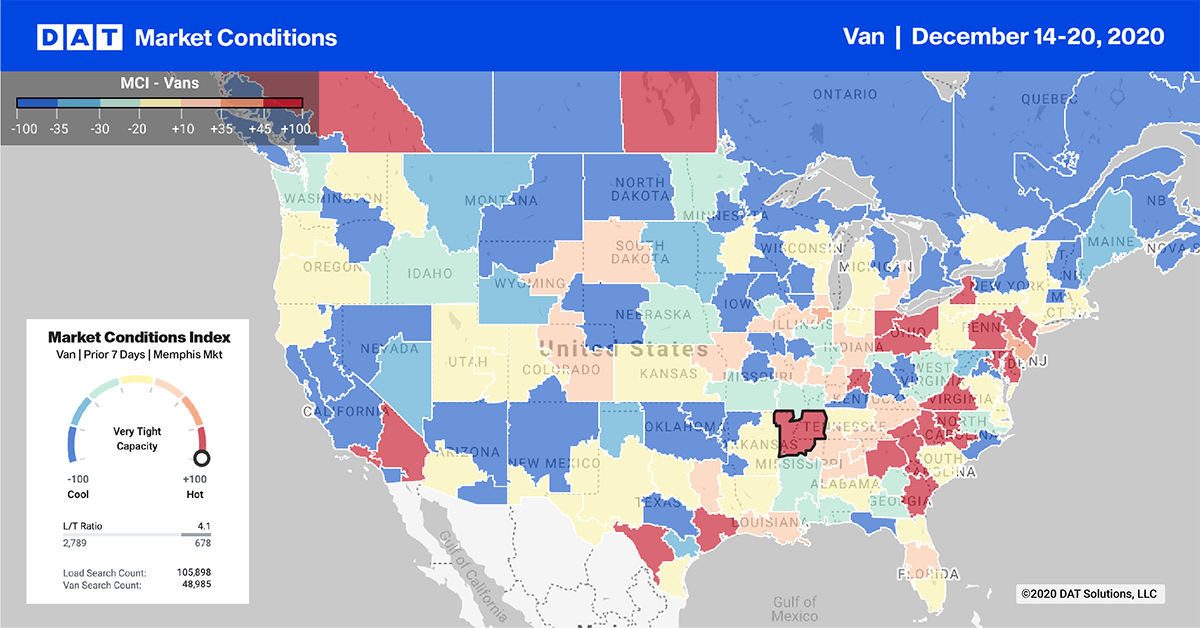
Outbound load volumes increased last week in four of our top 10 freight markets, although spot rates dropped for the third week in a row in all top 10 markets — a sure sign capacity is beginning to loosen.
Top 10 volumes were down on average 3% w/w, but up 21% w/w in Elizabeth, NJ (#3) and down 6% w/w in Atlanta (#1).
Spot rates in all top 10 markets dropped this week down on average $0.06/mile. Port congestion on the West Coast has driven warehouse capacity to its limits slowing down the unloading of more recent imports. As a result, load post volumes continue to decline in Los Angeles (#15) and Ontario (#14), which were down close to 8% w/w with rates also down $0.14/mile in both markets.
Even though load post volumes on the spot increased in the last full shipping week before the holiday break, Dry Van spot rates decreased by $0.03/mile to end the week at $2.22/mile (excl. FSC). Rates remain up 33% y/y and $0.55/mile higher than the same week in 2019.


