The December 2020 report on manufactured durable goods from the U.S. Census Bureau showed mixed results.
December durable goods orders rose 0.2% m/m for the eighth month in succession, while shipments increased by 1.4% m/m. Both measures are still down year over year, though, 7% and 5% respectively.
For flatbed carriers, the 2.4% m/m increase in core durable goods new orders of machinery is positive news, along with primary metals (up 0.3% m/m), and fabricated metal products (up 0.6% m/m).
Core Capital Goods New Orders (nondefense capital goods used in the production of goods or services, excluding aircraft) is an important gauge of business spending. In December 2020 this category made up 63% of total durable goods orders and recorded a 0.6% m/m increase.
Find flatbed loads and trucks on the largest on-demand freight exchange in North America.
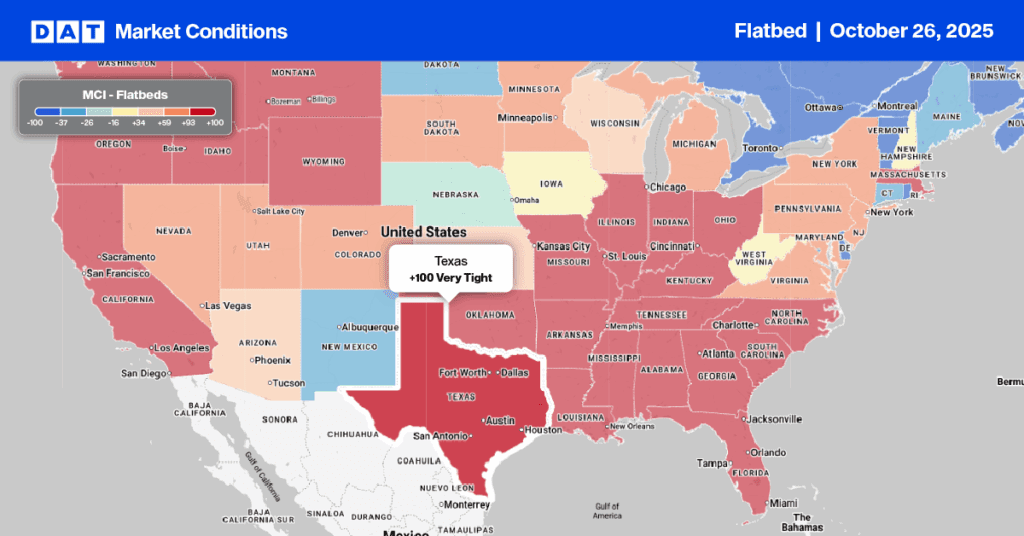
Load posts in the top 10 flatbed markets jumped by 26% last week, and unlike the reefer and dry van sectors, spot rates increased in most markets.
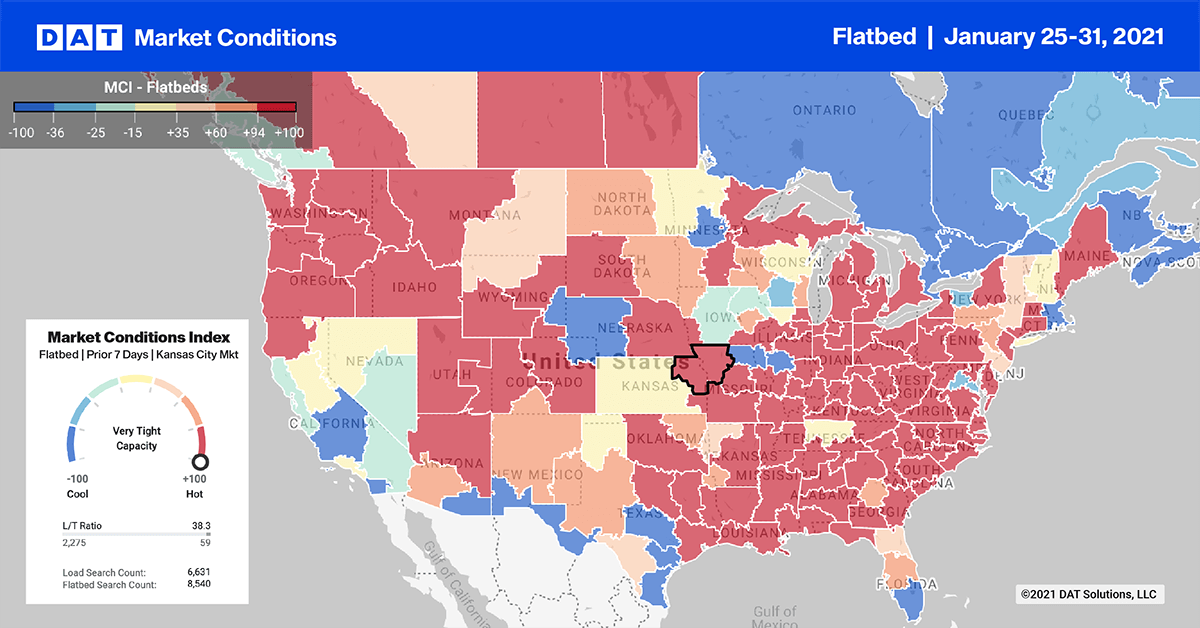
Memphis volumes increased by 34% w/w and in neighboring Little Rock, AR, volumes increased by 7% w/w. Capacity was flat in Memphis but much tighter in Little Rock, as spot rates climbed $0.24/mile to $2.56/mile for outbound loads. Three-day average rates on the 372-mile Little Rock to Birmingham, AL, lane are very tight this week, with rates averaging $2.96/mile and as high as $3.89/mile for some loads.
In Buffalo, a 12% w/w increase in load post volumes drove up spot rates by $0.40/mile to an average $3.70/mile. Capacity was very tight on the Buffalo-Raleigh, NC, lane, with spot rates averaging $4.05/mile and as high as $4.89/mile for top paying loads.
Spot Rates
There’s a Groundhog Day theme to flatbed spot rates, which remain largely unchanged for the last 3 months, ending last week where they started at $2.19/mile excluding fuel. Compared to the same week in 2020, flatbed rates are still $0.40/mile higher.
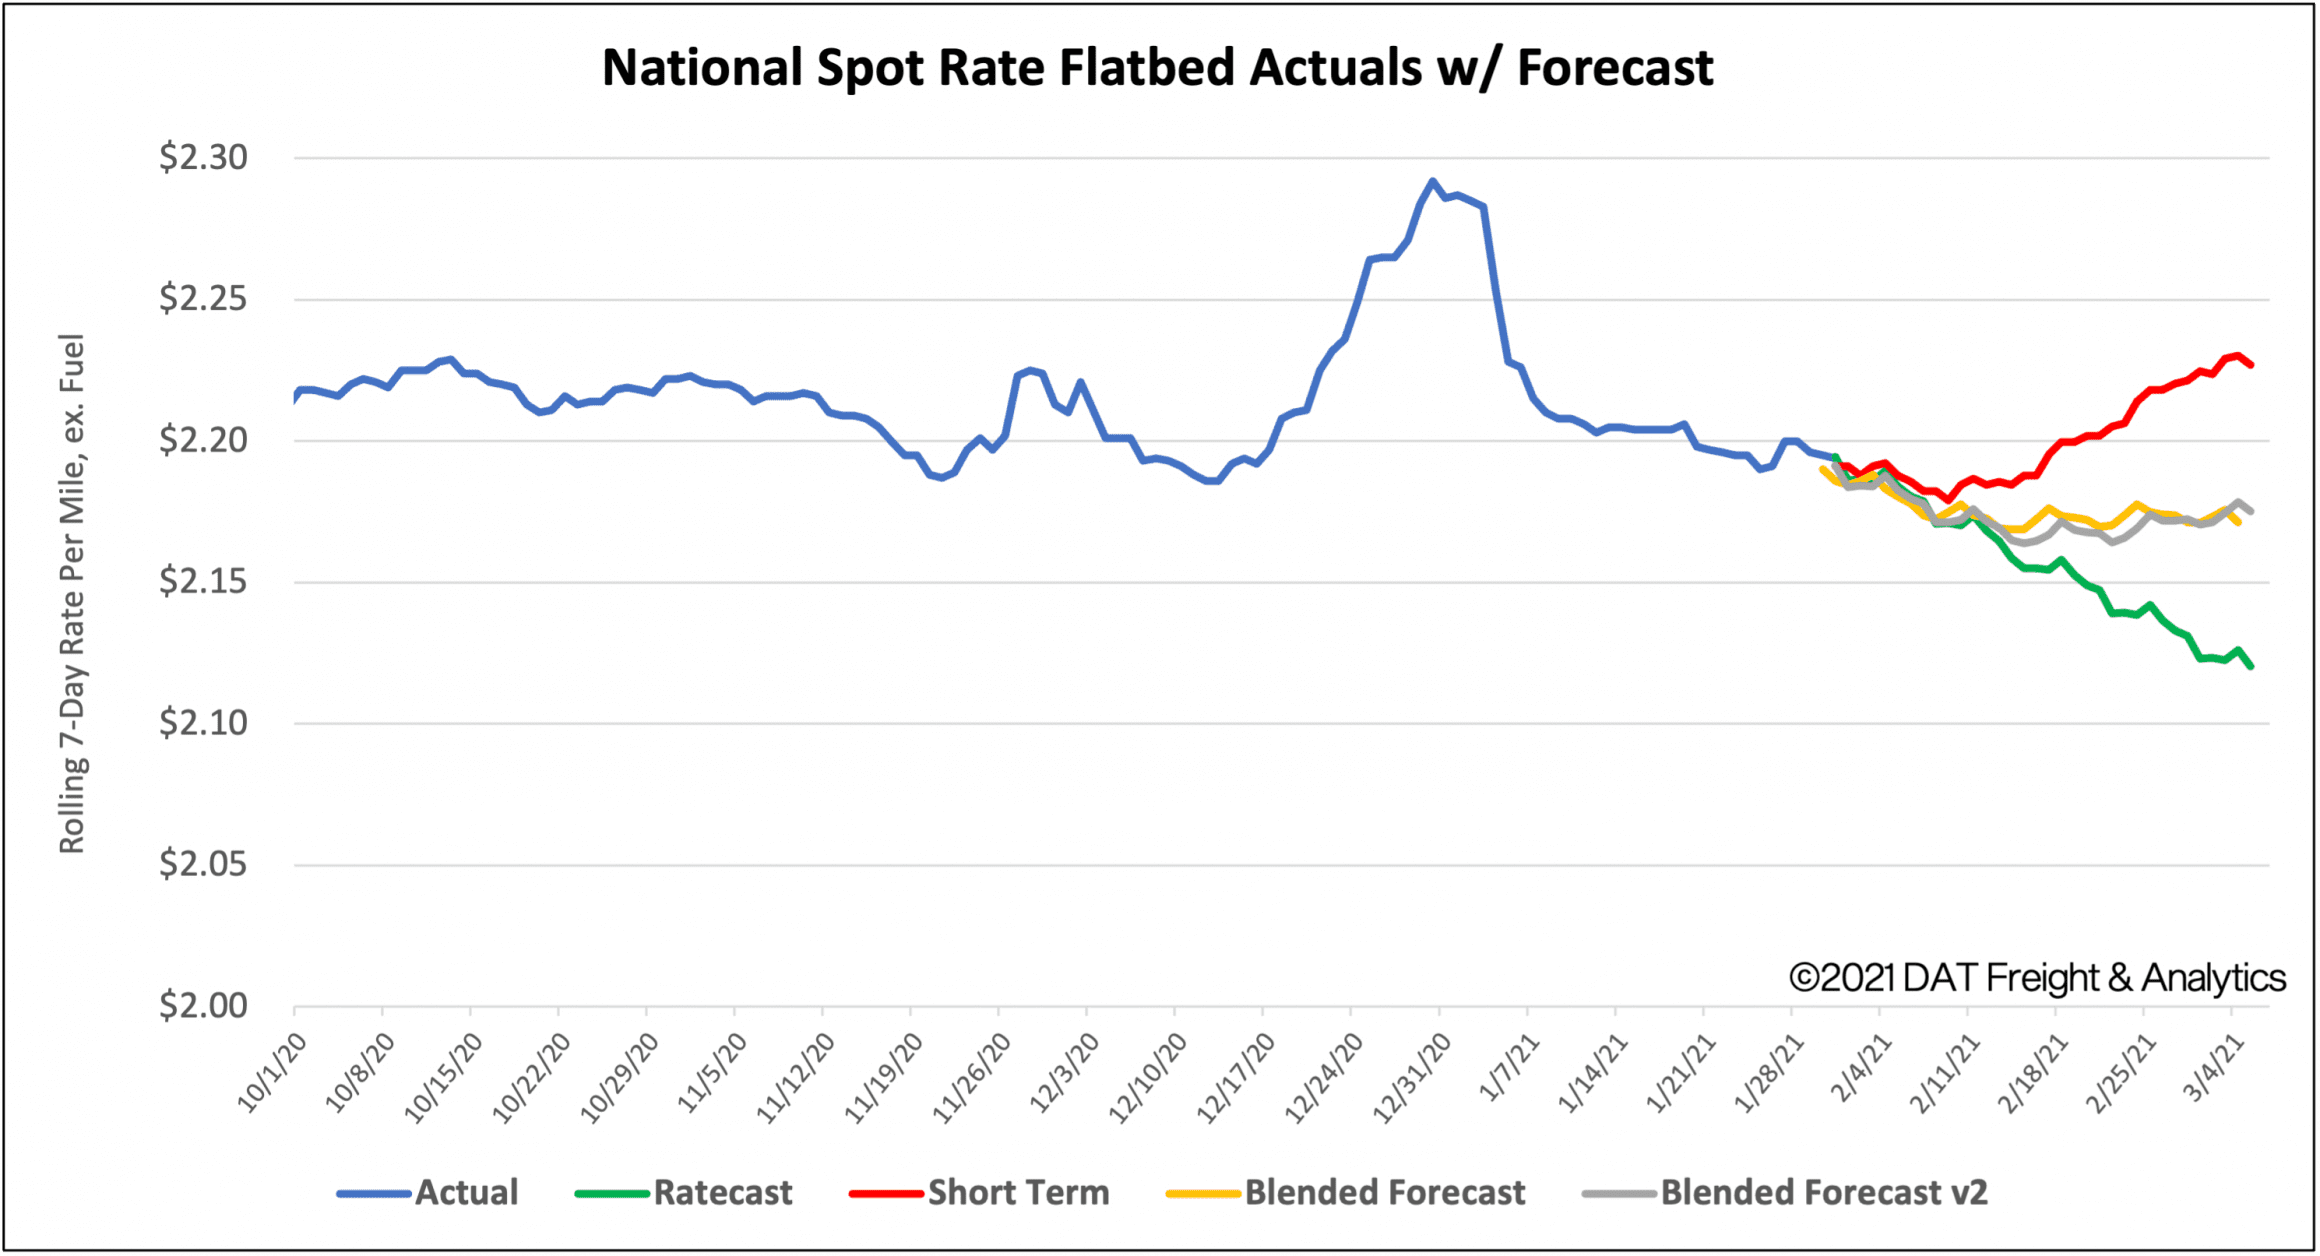
How to interpret the rate forecast
1. Ratecast Prediction: DAT’s core forecasting model estimate showing continued optimism and rate growth.
2. Short Term Scenario: Formerly the pessimistic model that focuses on a more near-term historical dataset.
3. Blended Scenario: More heavily weighted towards the longer-term models.
4. Blended Scenario v2: More heavily weighted towards the shorter-term models.
> Learn more about Ratecast predictions available in RateView.