Produce continues to roll in across both borders, but the mix of produce is very different at each commercial zone crossing. Overall, total imported truckloads are up 6% over last week, although volumes typically begin to decrease this time of the year ahead of the surge in domestic volumes.
According to data from the USDA, Mexico continues to dominate with 88% of all truckloads (n=4,726) in April with Canada picking up the remaining 12% of loads (n=619).
Potatoes are still the number one commodity crossing the Canadian border, with potatoes making up 57% of all loads. Almost half of those loads enter via Maine after being loaded on Prince Edward Island — the leading Canadian province for potato production. Manitoba volumes were second and crossed mostly in North Dakota, accounting for 12% of potato loads. The other main vegetable imported from Canada in April was carrots at 14% of truckload volume.
On the southern border, tomatoes were the number one vegetable at 18% of all truckloads in April. Tomatoes are followed by avocados (15%), peppers (14%) and cucumbers (10%). The two main crossing points were Pharr, TX (30% of truckloads) and Nogales, AZ (26%).
However, the four main commercial zones in Texas combined for 48% of April’s produce volume with a 50/50 split between fruits and vegetables at the state level.
Further west in Arizona, vegetables account for 90% of all truckloads with a lot of this volume destined for Las Vegas, Phoenix, Salt Lake City and Seattle. Tomatoes, cucumbers, peppers and squash accounted for close to 90% of produce volume via Nogales in April.
Find loads and trucks on the largest load board network in North America.
Note: All rates exclude fuel unless otherwise noted.
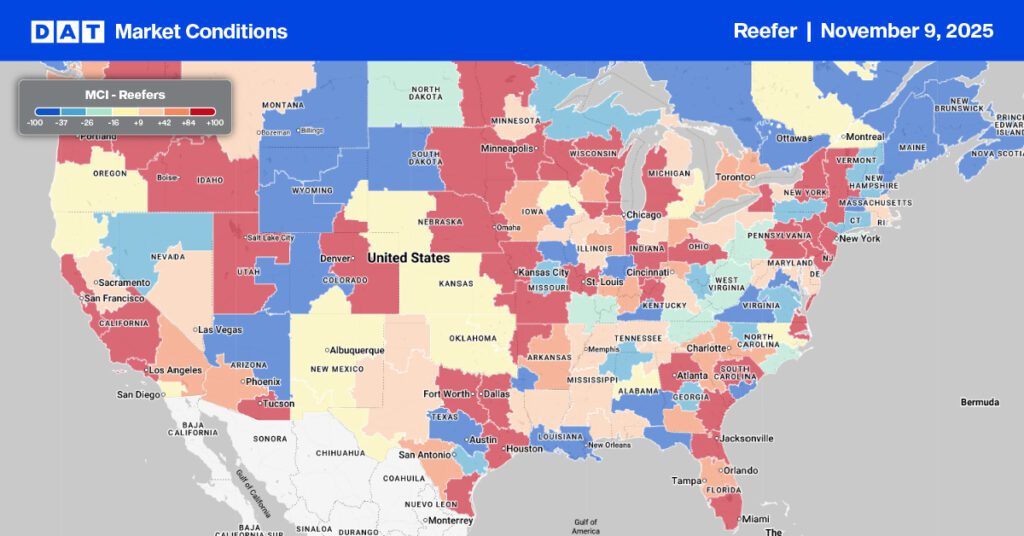
Even though outbound load post volumes dropped in Miami and Lakeland, FL, capacity tightened again. Spot rates were pushed up by $0.27/mile to $2.73/mile and $0.14/mile to $2.35/mile respectively. On the West Coast, volumes in Los Angeles were up as strawberry season volumes peaked, pushing up rates by $0.07/mile to $3.23/mile. In Ontario, CA, volumes were up 7% this week. Ontario market’s capacity was also tight following a $0.04/mile increase to $3.41/mile last week.
Spot rates
Reefer spot rates increased by $0.19/mile last week to end the week at $2.82/mile. Reefer carriers typically average 12% fewer equipment posts during Roadcheck Week, but this year that jumped to 20% resulting in an acute capacity crunch. This was similar to the impact of the recent Polar Vortex. Last week’s reefer spot rates were $1.04/mile higher this time last year and $0.65/mile higher than this time in 2018.
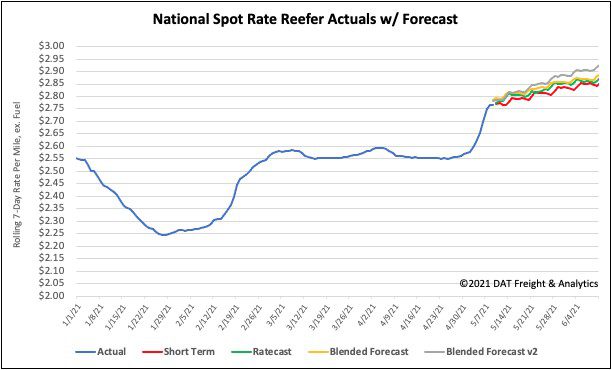
How to interpret the rate forecast:
- Ratecast: DAT’s core forecasting model
- Short Term Scenario: Formerly the pessimistic model that focuses on a more near-term historical dataset
- Blended Scenario: More heavily weighted towards the longer-term models
- Blended Scenario v2: More heavily weighted towards the shorter-term models