Flatbed and specialized carriers stand to gain the most from the Biden Administration’s new infrastructure plan with all of the steel and concrete products required to fix the nations’ bridges.
The American Road & Transportation Builders Association notes that more than one-third, or 220,000 (36%), of the nation’s 618,000 bridges need structural repair, rehabilitation work, or replacement.
This number includes the 45,023 structurally deficient bridges, which average 68 years old. Compare this to the average 32 years for bridges in good condition. The busiest structurally deficient bridge is on U.S. Route 101 over Kester Avenue in Los Angeles. It was built in 1959 and sees 289,000 daily travelers. The second is also in Los Angeles – Interstate 5 over Marietta Street, which was built in 1948.
Unlike dry van and reefer loads in enclosed trailers where the trailer walls act as load securement, flatbed loads need to be physically secured by straps or chains. This makes flatbed loads more vulnerable to rough roads and bridges.
This is especially true when bridges have significant height gaps between the blacktop and bridge surface, creating turbulent entrances and exits. Not only does this road to bridge transition add more wear and tear to heavy vehicles and drivers, it creates significant stress on the load itself and adds more cost to the flatbed sector.
Find loads and trucks on the largest load board network in North America.
Note: All rates exclude fuel unless otherwise noted.
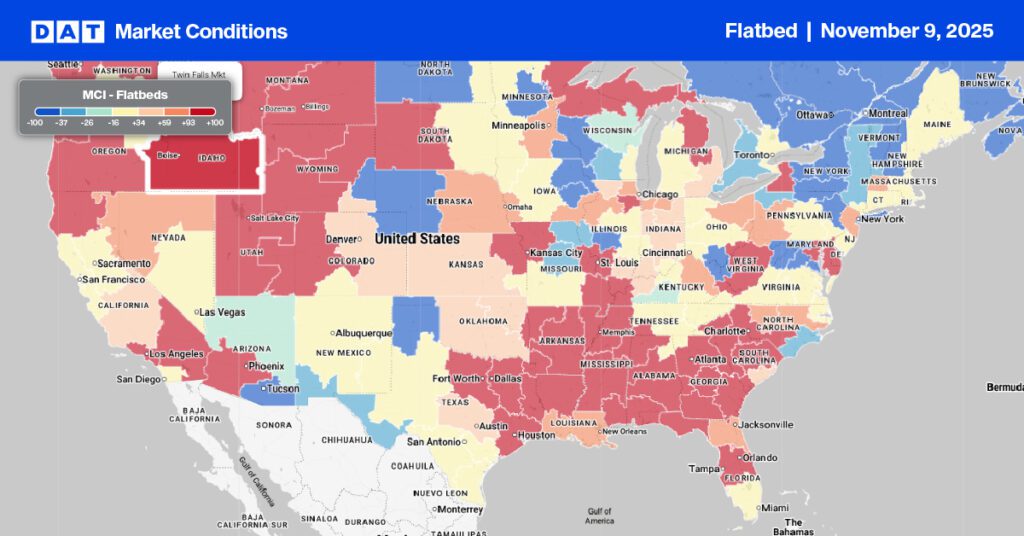
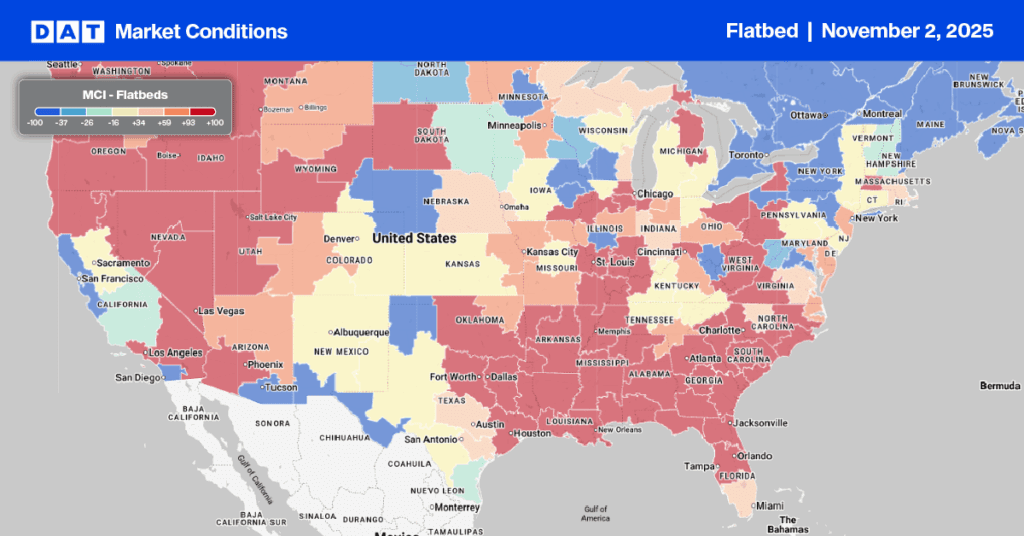
Flatbed rates in the Top 10 markets remained flat last week at an average of $3.46/mile. Outbound load post volumes dropped by 3%.
But as has been the case for many weeks, there has been substantial volatility in some markets in the South Region. In Mobile, volumes were down 6% last week while spot rates surged increasing by $0.44/mile to $3.42/mile. In contrast, nearby Little Rock volumes were down by just over 1% and rates were up $0.20/mile to $3.58/mile.
Spot rates
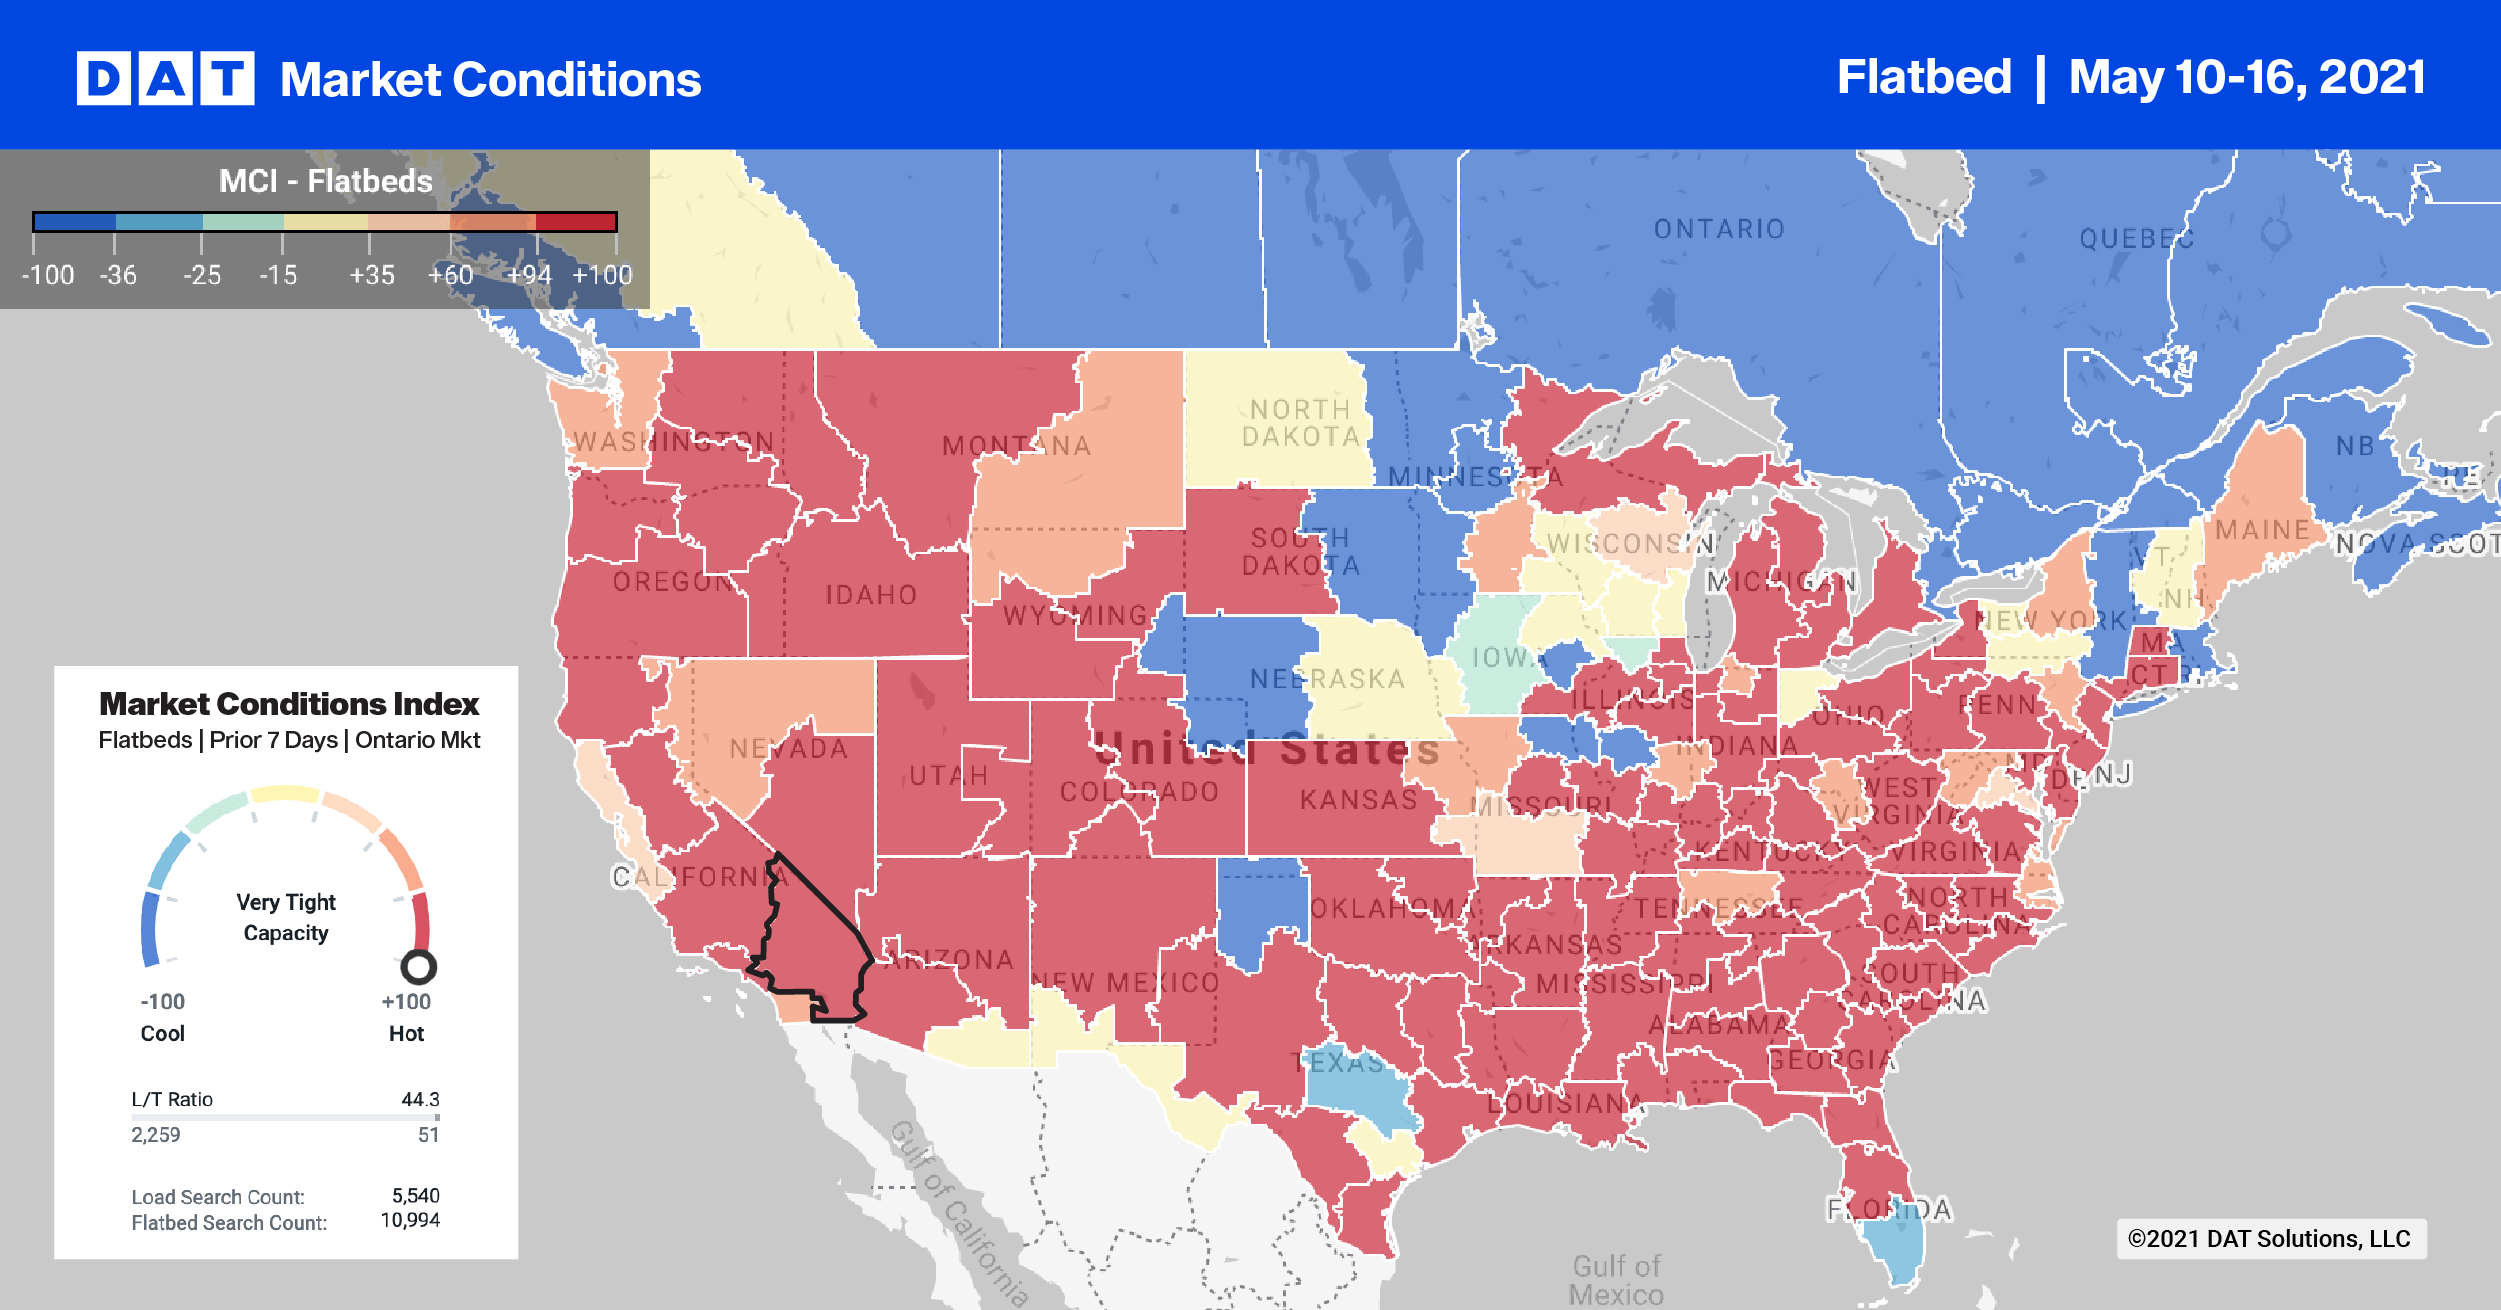
Capacity continues to tighten in the flatbed sector with spot rates increasing another $0.07/mile last week to reach $2.74/mile. Flatbed rates are now $1.01/mile higher than the same week last year and $0.28/mile higher than the same time in 2018.
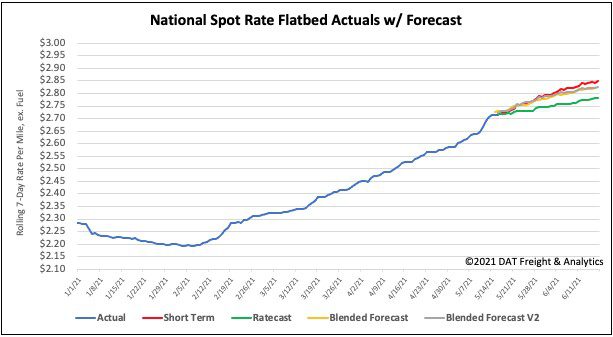
How to interpret the rate forecast:
- Ratecast: DAT’s core forecasting model
- Short Term Scenario: Formerly the pessimistic model that focuses on a more near-term historical dataset
- Blended Scenario: More heavily weighted towards the longer-term models
- Blended Scenario v2: More heavily weighted towards the shorter-term models