Following close on the heels of the six-week cherry season (mid-April to May) in central California, the Northwest cherry season is about to kick-off with harvest expected to begin on June 1. The USDA indicates Washington state produces around 70% of cherries in the U.S. California is a distant second at 18% and Oregon is third at 7%.
The Northwest’s 2021 cherry crop is estimated to produce 23.79 million cartons, which is up 20% from the 19.83 million cartons in 2020 and up 2% from 2019.
For carriers who rely on produce out of Pacific Northwest freight markets, almost 100% of annual cherry production will be shipped over a 12-week period. This equates to around 10,300 truckloads of cherries, or an average of about 900 truckloads per week.
Unlike most fruit, cherries ripen on the tree and are generally harvested, packed and on the shelf of your favorite retailer within two days. This puts pressure on brokers and carriers to ensure capacity is always available and deliveries are on time in destination markets.
Find loads and trucks on the largest load board network in North America.
Note: All rates exclude fuel unless otherwise noted.
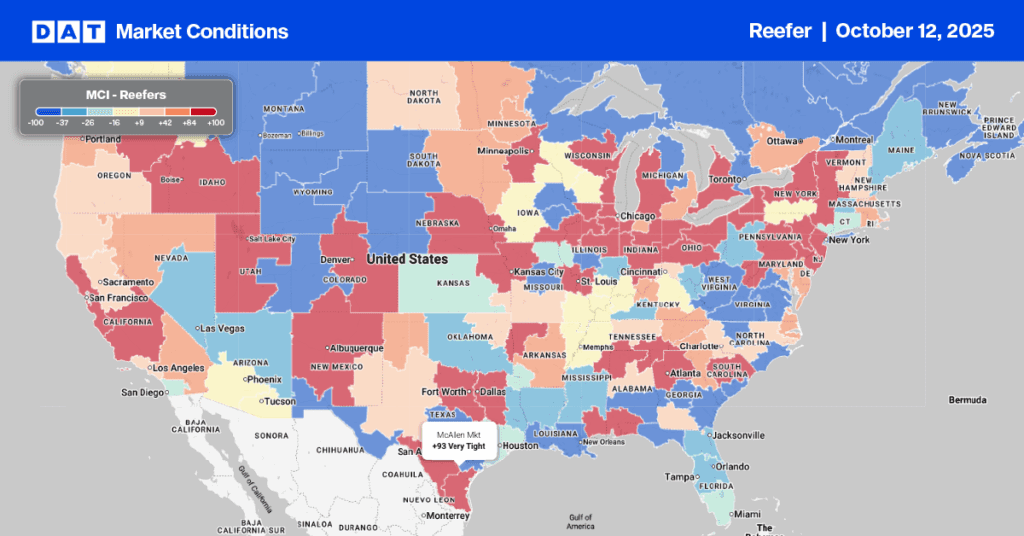
Top 10 outbound load post volumes decreased by 3% last week. Spot rates also decreased slightly by $0.01/mile to an average outbound rate of $2.95/mile.
Volumes in Atlanta were down 15% and capacity eased with spot rates dropping by $0.05/mile to an average of $3.01/mile.
Capacity loosened in Lakeland where rates dropped by $0.03/mile to $2.49/mile. Further south in Miami, volumes dropped 7% and spot rates plunged by $0.13/mile to $2.56/mile. This marks the expected slowdown in the region’s produce season.
On the West Coast in Fresno, volumes declined 7% but capacity continues to tighten as rates reach $3.25/mile after increasing by $0.07/mile last week.
Spot rates
Reefer spot rates cooled off again last week, dropping by $0.01/mile to $2.77/mile. Reefer spot rates are still at record-high levels and are $0.89/mile higher than this time last year and $0.54/mile higher than this time in 2018.
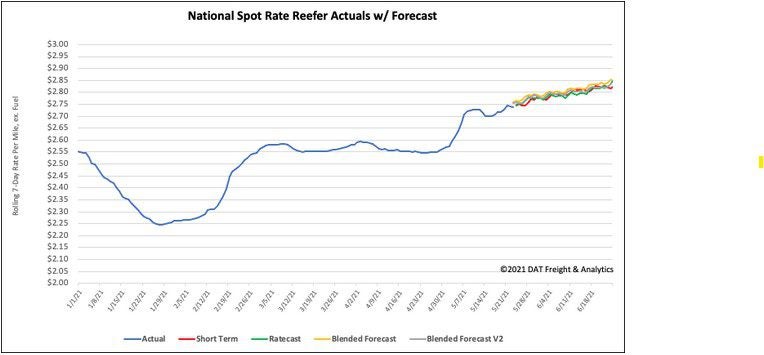
How to interpret the rate forecast:
- Ratecast: DAT’s core forecasting model
- Short Term Scenario: Formerly the pessimistic model that focuses on a more near-term historical dataset
- Blended Scenario: More heavily weighted towards the longer-term models
- Blended Scenario v2: More heavily weighted towards the shorter-term models