Over the past few weeks, freight rates have surged to multi-year highs and capacity was diverted, causing truck shortages in some key markets. Consider these recent milestones, compiled from DAT RateView:
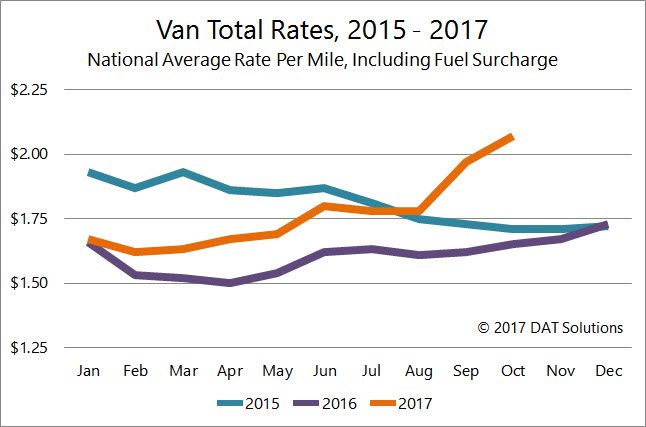
- Vans – During the first week in October the national average van rate rate hit $2.09 per mile on the spot market. The van rate hasn’t been that high since late 2014. During the last week of September the van load to truck ratio hit 7.0 loads per truck, the highest ever recorded in DAT Trendlines, which was first published in 2010.
- Flatbeds – The last week in September also brought record flatbed demand, sending the load-to-truck ratio soaring to 50.2 loads per truck—its highest mark in years. The average flatbed rate has also climbed to $2.33 per mile.
- Reefers – The highest national reefer rate in nearly 3 years was experienced during the first week in October, when the rate hit $2.37 per mile. That same week the load-to-truck ratio was 12.4 loads per truck.
What’s driving demand?
The past couple months have churned up a perfect storm of supply chain pressure. Hurricane Harvey hit the Gulf Coast in late August, follow shortly after by Hurricane Irma. Fuel prices rose, and relief and rebuilding efforts lured trucks southward, leaving fewer trucks to handle fall harvests and move manufactured goods from ports.
December could be busy
The big question is, what will happen next? After climbing for seven straight weeks, last week van rates backed off 2¢ and reefer prices dipped 1¢. Flatbed prices, however, continued to rise. We don’t know what will happen in the next couple months, but we may get a clue from looking at data from previous years.
As you can see from the Van Rates chart above, during the past two years, rates remained fairly stable in October and November, but began rising in December. Before 2013, December tended to be a slower month for freight, as merchandise had to be on store shelves by Black Friday. The rise of e-commerce has pushed delivery dates right up to the holidays. The busy season even continues through part of January, to service gift card redemption.
This year, there will be a new pressure point in December: The ELD Mandate takes effect Dec. 18. Analysts predict that some drivers will leave the industry, and others who are new to ELDs may experience a dip in productivity, at least temporarily.
Capacity Remains Tight
As noted above, load-to-truck ratios have also hit new highs. The load-to-truck ratio measures the number of load posts on DAT load boards vs. the number of truck posts. The ratio is a good indicator of supply and demand, and when the ratio rises, rates will often follow suit.
The Hot States Map on the left shows outbound van load-to-truck ratios by state for the second week of October 2016. The map on the right shows conditions for the same week this year.

RELATED CONTENT:
>DAT Freight Index Hits All-Time High in September
Want to see current market rates for more than 65,000 point-to-point lanes? Get DAT RateView or have rates rates integrated into your DAT load board. The DAT Power load board also gives you access to the Hot States Map (shown above) and the Hot Market Map, which show daily load-to-truck ratios by state or metropolitan market. To learn more about DAT Power, request a demo or call 800-551-8847.