While there’s evidence emerging that truckload volumes may be stabilizing, the direction of spot rates remains uncertain, with upward pressure on prices as carriers continue to reject surge volume from shippers on their contracted lanes.
Freight volumes for certain commodities have been on a rollercoaster ride for the last five months. Early in the pandemic when the country went into the lockdown, the biggest movers were (not surprisingly) food, beverages, FAK (freight-all-kinds) and paper, which increased by 155%, 192%, 119%, and 123% month over month respectively. Total load volumes for the top ten commodity types were up 122% m/m at the end of March and more than double the volume in March 2019, as consumers rushed to stock up with supplies.
As a result of a lot of panic buying, shippers and retailers experienced inventory control failures at an unprecedented level in April, load volumes accordingly dropped by 64% as manufacturing output plummeted only to rebound in May and June increasing by 135% m/m before dropping again by 52% m/m in July.
It seems certain warehouse inventories have been replenished by now, given load volumes for the top ten commodities have slowed considerably and are now just under 2019 levels. Inbound load volumes also slowed for top 10 on-demand warehouse fulfillment freight markets (Stockton, CA; Ontario, CA; Phoenix, Denver, Joliet, IL; Elizabeth, NJ; Allentown, PA; Indianapolis, Memphis and Lexington, KY), following the initial surge in import volume in June.
As for the peak shipping season that normally occurs between now and October, we may have already witnessed this year’s peak in June – time will tell.
Dry van trends
Market Condition Index (MCI)
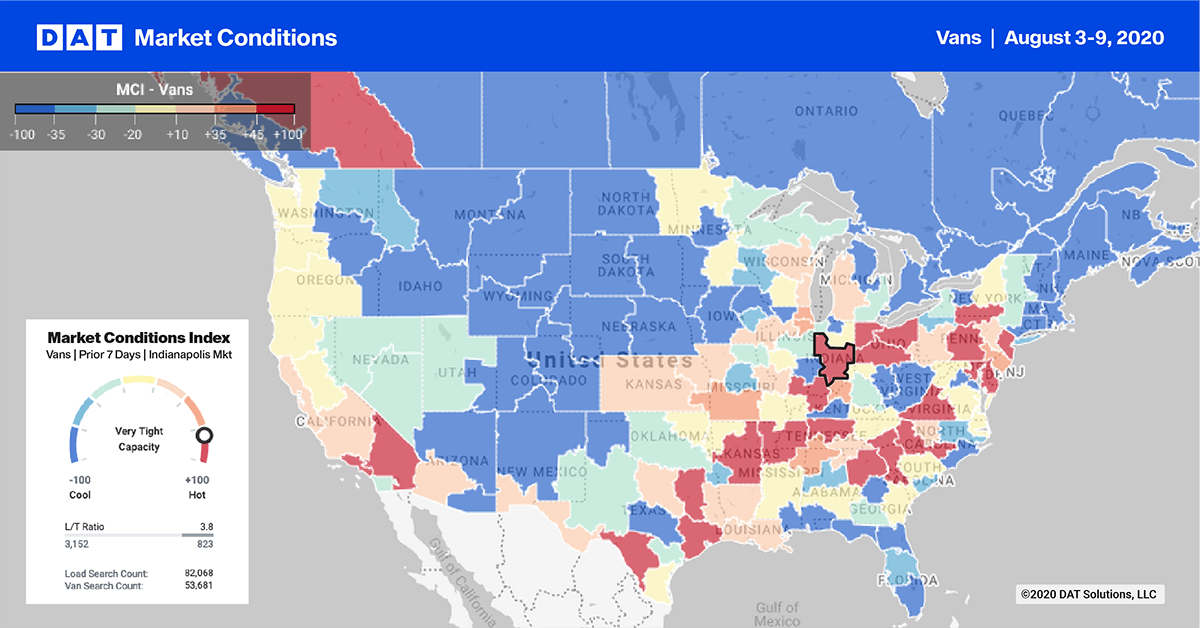
On the West Coast, outbound volumes continued to climb for the fifth week in the Ontario, CA, market, now up 3% w/w and 31% m/m. Rates followed suit, increasing 4% w/w and 9% m/m on the majority of outbound lanes, with rates peaking at $2.85/mile on the Ontario-Dallas lane, which was the number one outbound destination. Neighboring West Coast market Los Angeles recorded the 3rd highest load counts to Dallas for a combined 11% of all SoCal loads into Dallas last week.
The large Atlanta market continues to struggle, with load volumes down 4% w/w for the fifth week in succession and now down 34% m/m. Spot rates out of Atlanta have plateaued in the $1.98 to $2.02/mile range for the last four weeks. In the Midwest, load volumes continue to climb out of automotive manufacturing markets, including Detroit, Cleveland, Toledo, OH, and Columbus, OH.
> Learn more about the Market Conditions Index
Spot van rates
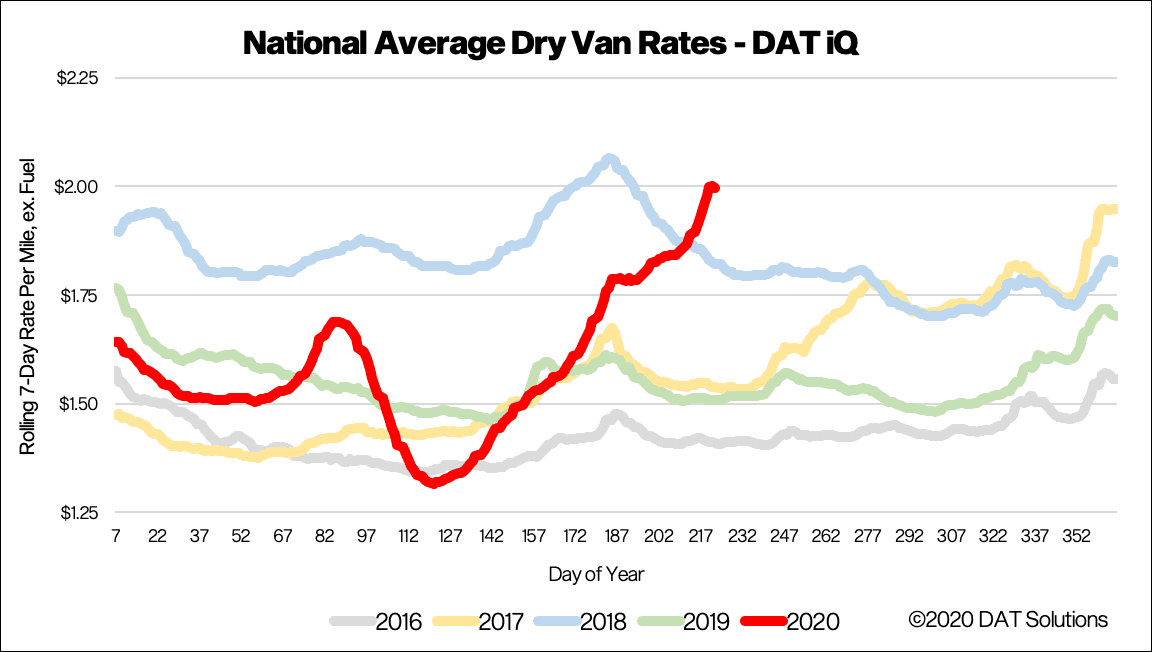
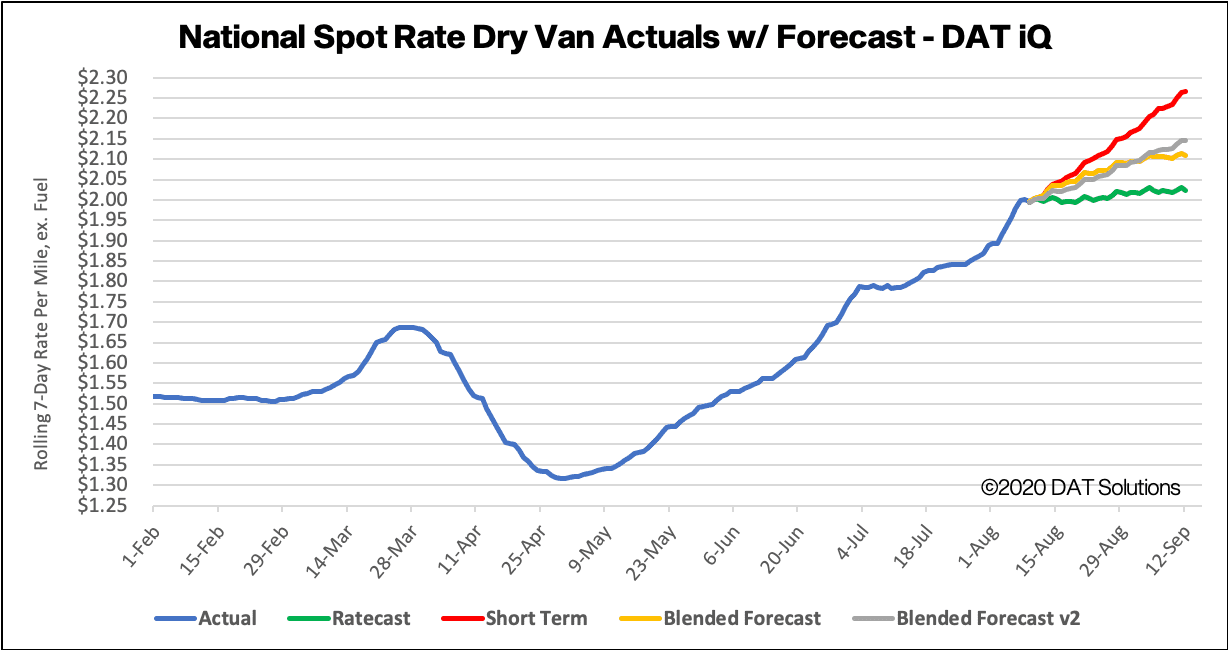
Spot market load volumes continued to climb last week, as carrier networks remained out of balance, increasing 10 cents to $2.00/mile, excluding fuel – the highest dry van rate for this time of the year in the last five years. National average van rates are now 49 cents higher than the same week in 2019.
The Ratecast predictive model from DAT iQ expects dry van rates to plateau in the $2 to $2.03/mile range over the next four weeks, which is consistent with the short-term outlook of most industry analysts. The assumption here is that demand stays on the same trajectory, but with so much uncertainty in the absence of an economic stimulus package from Congress, it’s very difficult to determine if the current level of demand continues or begins to taper off in coming weeks.
> Learn more about freight rate tools from DAT iQ
Spot rate forecasts
Forecasting during this volatile period is difficult. Our team is working diligently to update and adjust the models, but new information becomes available at a rapid pace. DAT would typically not publish these types of preliminary studies, but we feel that the benefit of sharing our observations far outweighs the risk. We ask that you please treat these statements and exhibits as directional and consider them as a variable in your own analyses.
How to interpret the rate forecast
- Ratecast Prediction: DAT’s core forecasting model
- Short Term Scenario: Formerly the pessimistic model that focuses on a more near-term historical dataset.
- Blended Scenario: More heavily weighted towards the longer-term models.
- Blended Scenario v2: More heavily weighted towards the shorter-term models.
> Learn more about rate forecasts from DAT iQ
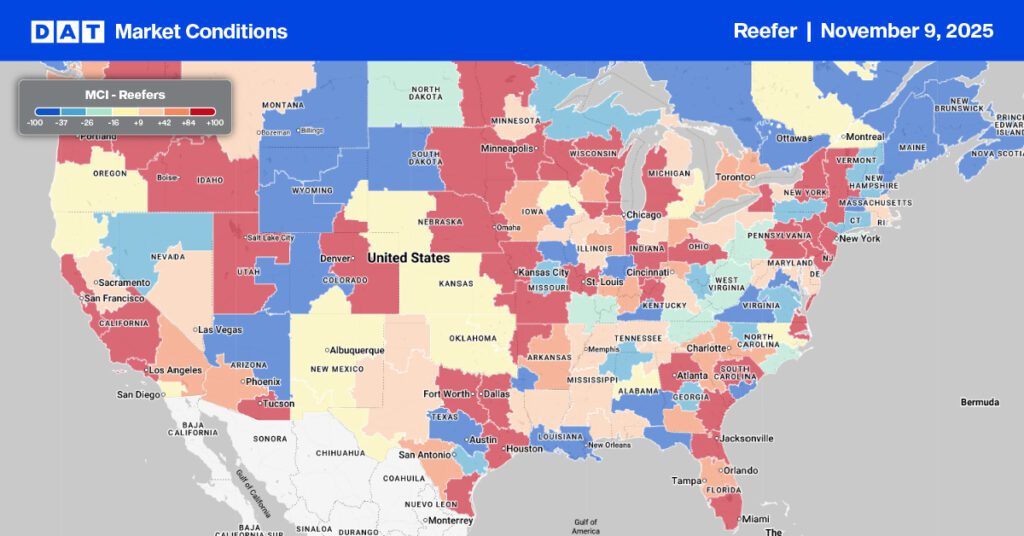
Reefer trends
Market Condition Index (MCI)
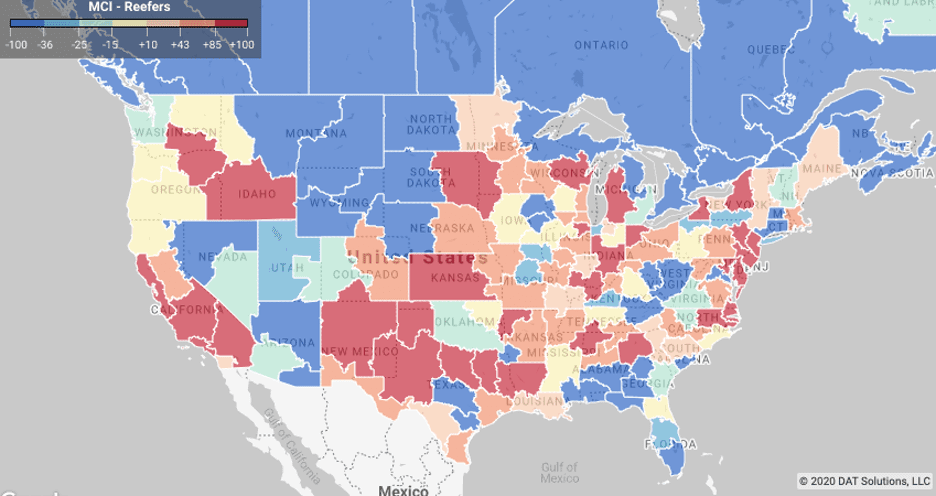
Elizabeth, NJ, has now seen four successive weeks of higher outbound volumes after a 4% w/w increase last week, which now has outbound volume up 43% m/m. The market imbalance continues to widen as inbound volumes continue to fall, now down 6% w/w and 11% m/m.
Volumes out of the Medford, OR; Portland, OR; Twin Falls, ID, and Pendleton, ID, markets continue to dominate production in the Pacific Northwest, with outbound refrigerated load volumes up 18% w/w and 30% m/m. The four-market average spot rate inched higher by 3 cents last week to $1.95/mile, with loads to Brooklyn, NY, paying carriers $2.36/mile. Produce season in the region is reaching its peak, with loads of potatoes, cherries, pears, apples and peaches keeping carriers busy. Even potatoes require refrigeration this time of the year, with a trailer set-point of 50 degrees.
Farther south in the San Diego market, the avocado crop has about 20% remaining to be harvested between now and early October, according to The Packer. The California 2020 crop is expected to reach just over 9,300 refrigerated truckloads, which has contributed to outbound volumes increasing by 12% w/w and 44% m/m. Reefer outbound rates are also up 4% w/w and 8% m/m averaging $2.66/mile last week on 46 origin-destination pairings.
This week, the USDA reported seasonal year-over-year volumes of produce decreased last week 6% for domestic and 17% for imported truckload shipments. A shortage of trucks was reported for watermelons and cantaloupes in Maryland, Delaware and Eastern Shore Virginia, Southwest Indiana, Southeast Illinois, North Carolina, and the Southeast. A slight shortage of trucks was reported for peaches, nectarines, plums and grapes in the San Joaquin Valley and avocados in South District California. A slight shortage of trucks was also reported for onions in Southern New Mexico, and apples, pears, cherries, peaches, nectarines and prunes in the Yakima Valley & Wenatchee District in Washington.
> Learn more about the Market Conditions Index
Spot reefer rates
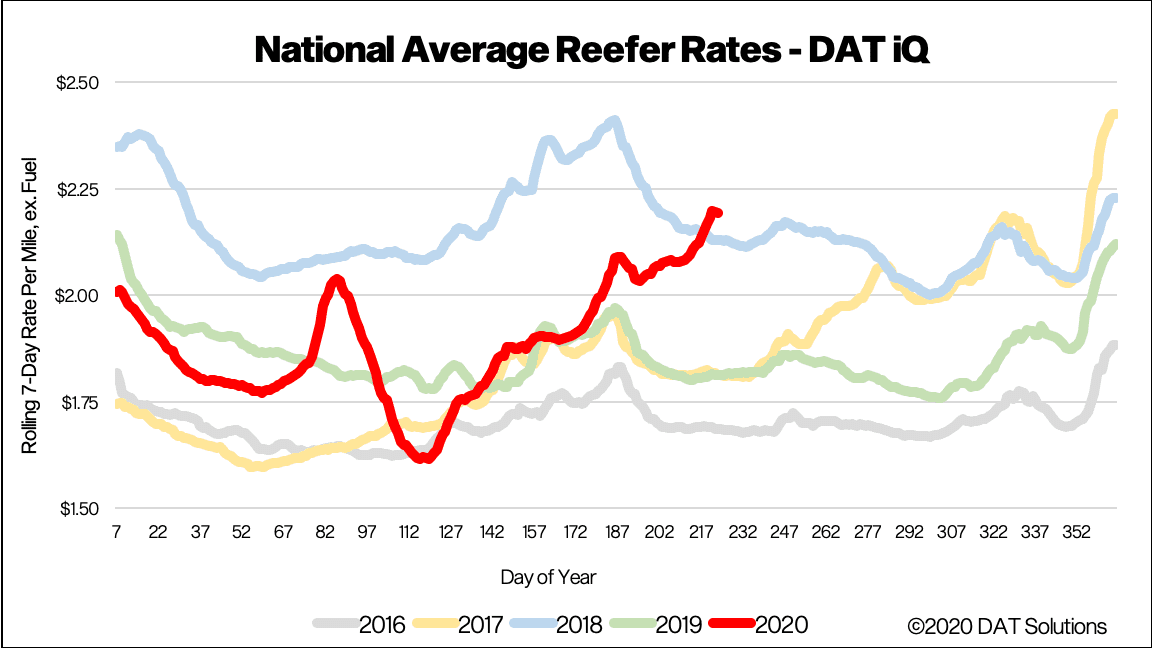
National average reefer rates rose another 7 cents to $2.19/mile, excluding fuel, which is now 18 cents higher than the same week in 2018.
August is typically peak shipping month in the produce sector, especially in the Southwest, West Coast and northern latitudes in general, so we expect a continuation of rate increases in coming weeks. Our flagship Ratecast model expects reefer rates to be up around $2.25/mile in early September.
> Learn more about freight rate tools from DAT iQ
Reefer forecasts
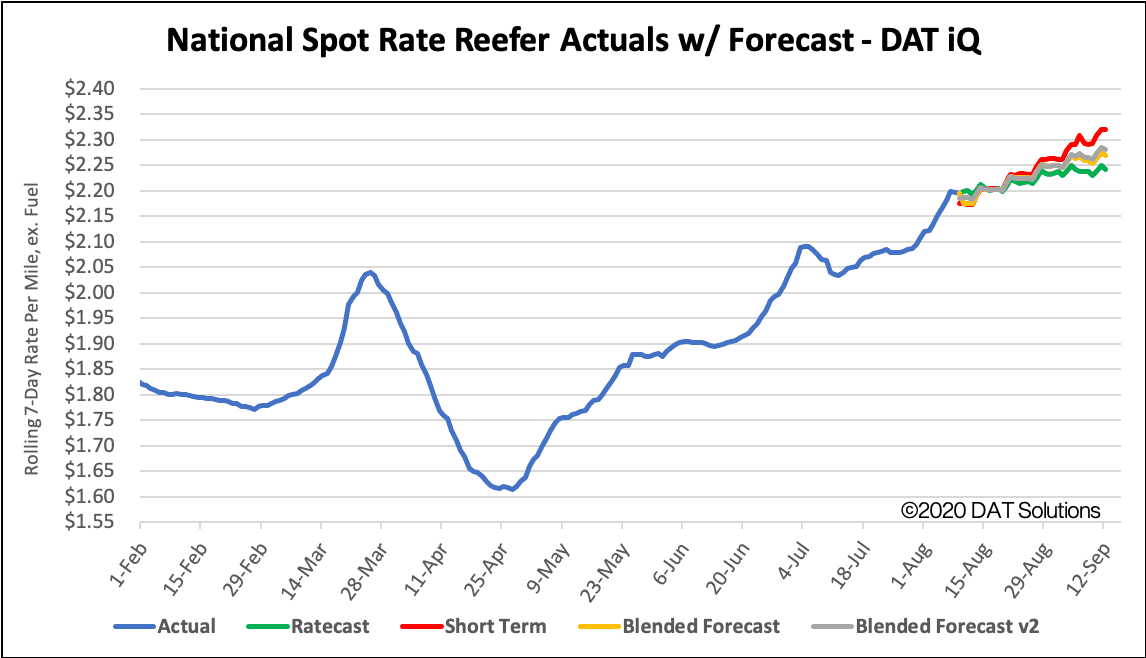
How to interpret the rate forecast
- Ratecast Prediction: DAT’s core forecasting model
- Short Term Scenario: Formerly the pessimistic model that focuses on a more near-term historical dataset.
- Blended Scenario: More heavily weighted towards the longer-term models.
- Blended Scenario v2: More heavily weighted towards the shorter-term models.
> Learn more about rate forecasts from DAT iQ
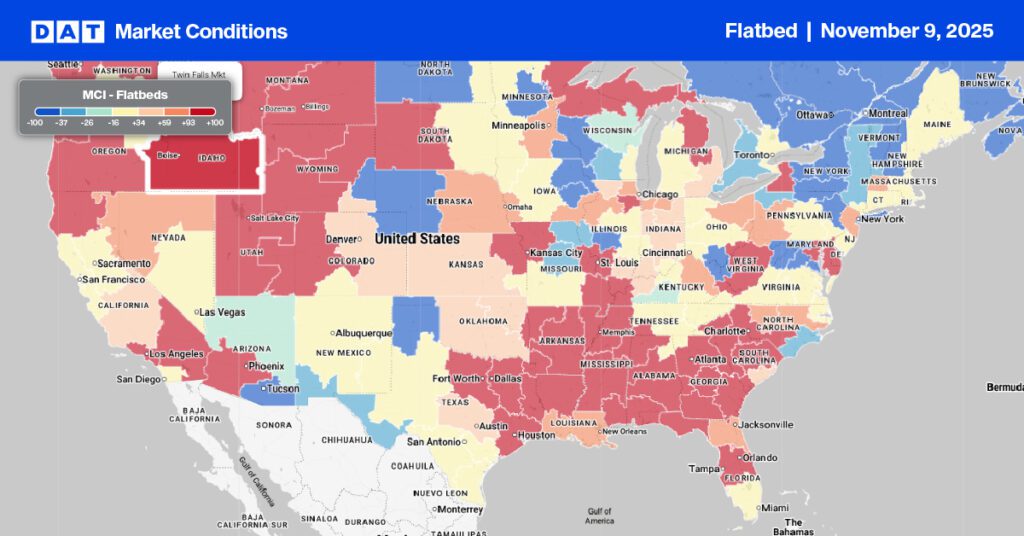
Flatbed trends
Market Condition Index (MCI)
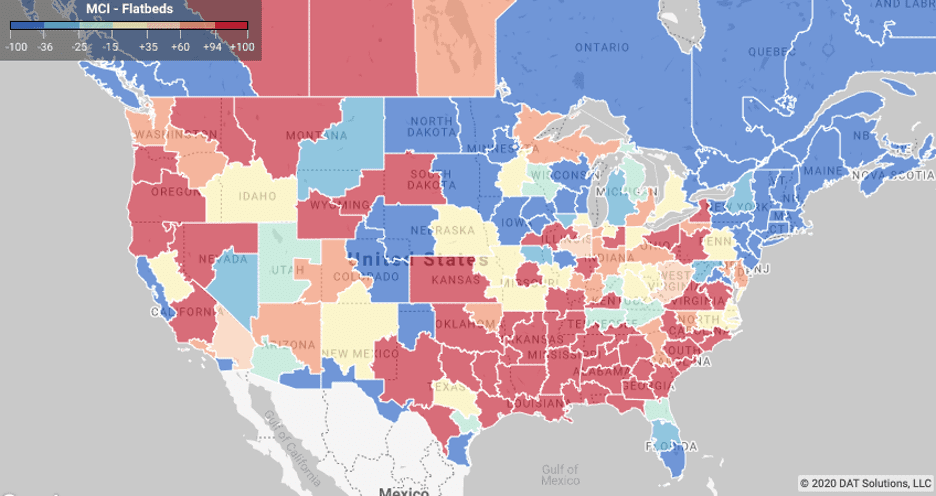
The lumber, building and construction sectors continue to dominate the flatbed market, although demand seems to be flattening and tracking the closest to seasonality of all equipment types. Hurricane season remains the wild card to watch in this sector.
> Learn more about the Market Conditions Index
Spot flatbed rates
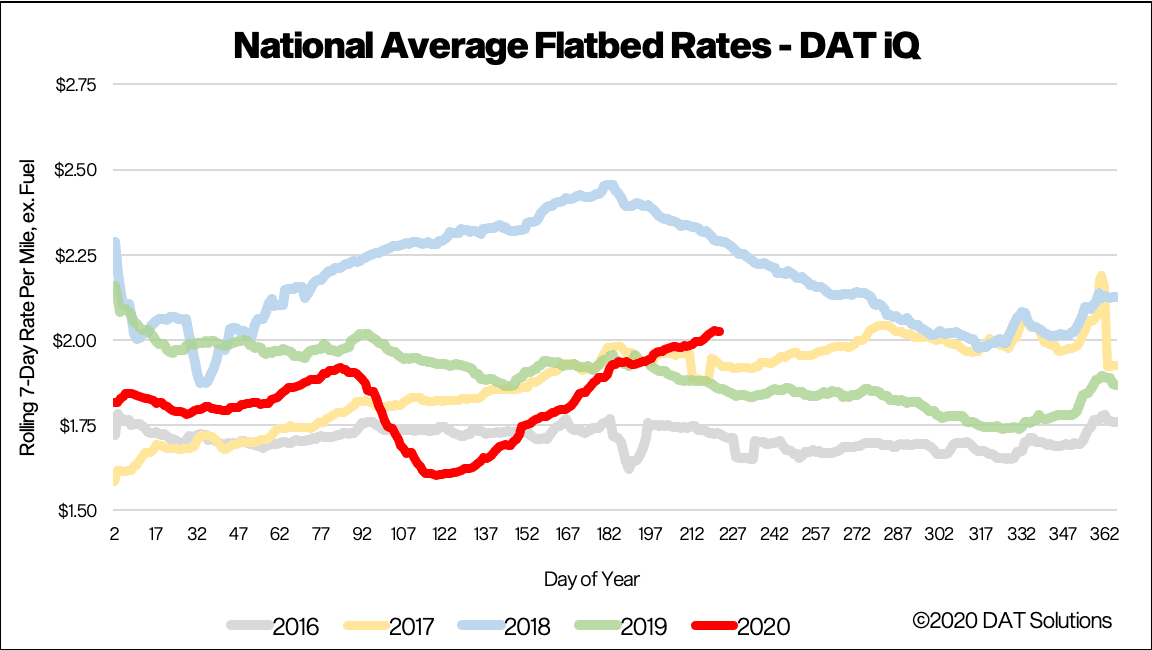
Flatbed spot rates increased by 1% w/w to $2.03/mile, excluding fuel – up 3 cents from the week prior. Flatbed rates are now 8% higher y/y but still 26 cents lower than the 5-year spot rate peak in 2018.
The pace of increase in flatbed rates appears to be slowing, with our models expecting an inflection point in rates in the short-term. This would place spot rates in the $1.95/range in early September, but with a more active hurricane season predicted by NOAA and another on the way towards Florida this week, a repeat of 2017 is a possibility (when capacity tightened following the numerous hurricanes in Sept ‘17).
> Learn more about freight rate tools from DAT iQ
Spot rate forecasts
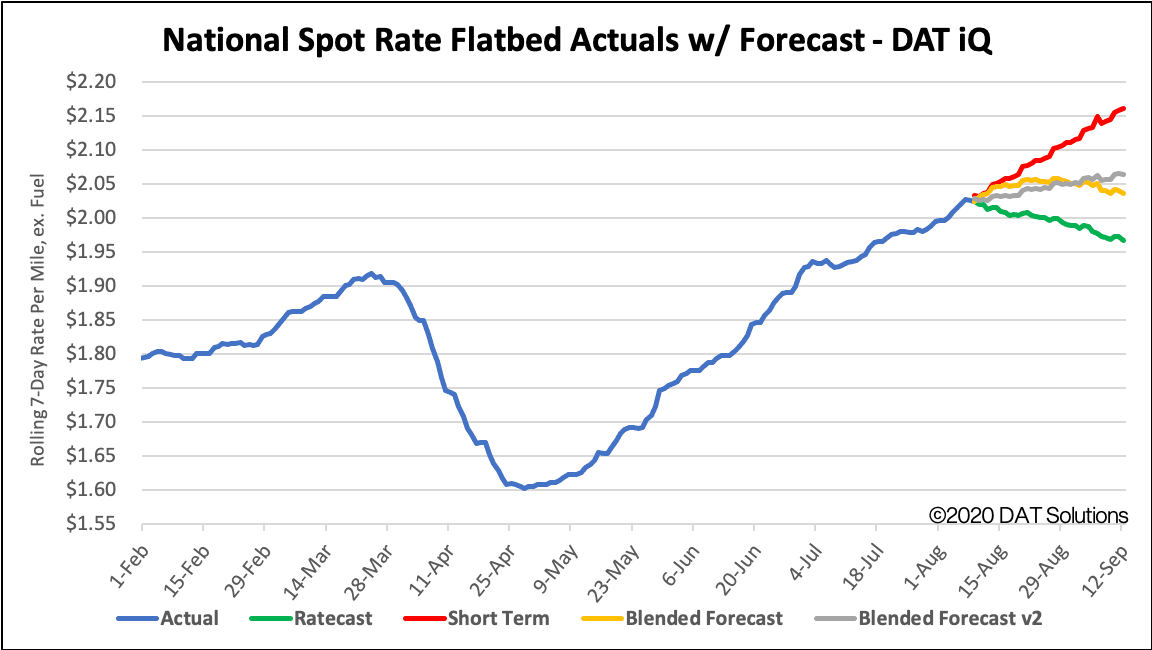
How to interpret the rate forecast
- Ratecast Prediction: DAT’s core forecasting model
- Short Term Scenario: Formerly the pessimistic model that focuses on a more near-term historical dataset.
- Blended Scenario: More heavily weighted towards the longer-term models.
- Blended Scenario v2: More heavily weighted towards the shorter-term models.
> Learn more about rate forecasts from DAT iQ
Need more information?
Our update will be refreshed next week, or sooner if conditions change materially. We recommend that readers visit DAT.com/blog for the latest information. Any questions on this report or market conditions can be emailed to askIQ@dat.com.
We are also making available, free of charge, the DAT Daily 50 which is a daily report of the top 50 lanes by volume with a week’s worth of history and predictions using the Ratecast model.