This week, we’re taking a look at the leading freight demand indicators for the truckload sector with much the same to report as last month – freight volumes are down overall, but it’s a very different story at the commodity level.
According to IRI, the world’s leading consumer point-of-sale data company, “since the pandemic began in the U.S., some retail categories have sustained sales increases of 15%-20%, while others are still down 5%-10% year-over-year”. IRI’s weekly CPG Demand Index, which tracks sales across categories, reports overall CPG demand is up 8% y/y but has decreased 4% since the start of the pandemic when pantry-stocking was at its peak.
In the brick and mortar sector, prepared deli meats are up 11% since June 1st with beverage sales up 3%, followed by health and home care products, which are up 5% and 4% respectively.
In the e-commerce category, CPG sales are up 34% y/y with beverages up 33% y/y, all overshadowed by beauty and health products—up by an impressive 40% y/y.
Tune into DAT iQ Live, live on YouTube or LinkedIn, 10am ET every Tuesday.
In contrast, carriers in the industrial manufacturing sector are seeing a different picture emerge as the economy struggles to gain momentum. According to the Census Bureau, industrial production for durable goods (wood, metals, machinery, etc.) was down 8.6% y/y and non-durable goods (meat, dairy, seafood, etc.) was down 7.1% y/y at the end of August.
Last week’s release of the ATA’s Truck Tonnage Index for September reported a 6.7% m/m increase, but compared to the same period in 2019, tonnage is down 3.3% y/y. According to ATA Chief Economist Bob Costello, “the truck freight market continues to be bifurcated, with strength in retail and home construction, but some continued weakness in industrial freight.”
The ATA For-Hire Truck Tonnage Index is dominated by contract freight, which typically represents around 80% to 85% of total freight hauled as opposed to spot market freight.
Similarly, the September Cass report showed freight volumes were 1.8% below this period last year. The Cass Freight Index is a reliable measure of North American freight volumes, with findings based on data derived from approximately 36 million invoices and $28 billion in annual freight invoices.
Finally, the new Michigan State University (MSU) Surface Transportation Index (STI), which captures economy-wide demand for truck and rail transport, indicates demand was down 4.9% y/y at the end of August. A sub-component of the STI is the MSU For-Hire Trucking Ton-Mile Index, which also reported that truckload demand is down 2.7% y/y.
As the pandemic drags on, consumers are settling in for the long-haul, continuing to purchase the physical goods (instead of services like vacations and travel) required for working and eating at home. In turn, shippers are rushing to restock depleted inventories, which for the short-term, points to a continuation of the current capacity tightness and level of demand until the end of 2020, and most likely right up until Chinese New Year in early February 2021.
Following the surge in imports from China (where exports are up 10% y/y) in June and July, the west coast is bracing for a record level of imports over the next two weeks according to the Journal of Commerce.
The Port of Los Angeles online tool Signal, indicates imports through Los Angeles will peak next week at 136,061 TEU’s (twenty-foot equivalent units), which is more than double the volume for the same week in 2019.
With capacity already tight in the Los Angeles and Ontario markets, another surge in import volumes will stretch capacity further, and put more upward pressure on spot rates.
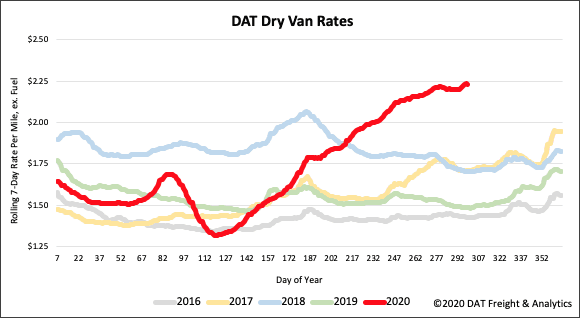
The recent announcement by Union Pacific Railroad that it will double surcharges (now $1,000 per container) on small shippers sending excess contract cargo out of Seattle, coincides with dry van truckload rates jumping $0.12/mile last week after three solid weeks of decline.
Seattle outbound load post volume also jumped 21% w/w with 17% of loads destined for the Los Angeles and Ontraio markets.
In our top 10 freight markets, load post volume decreased by 1% last week with Los Angeles and Ontario markets taking the top two spots, while record level import volume continued to surge. After weeks of declining volumes, load posts in the port market of Los Angeles jumped 25% w/w followed by Ontario where volumes increased by 19% w/w.
After a surge in inbound volumes in late September and early October, inbound volumes into Memphis are now down 23% m/m leading to the 8% w/w drop in outbound volume, driving spot rates down by $0.07/mile to $2.52/mile.
On the east coast in the Elizabeth NJ (#8) port market volumes dropped 6% w/w, although capacity tightened slightly resulting in rates moving up $0.02/mile to $1.90/mile last week.
Further south in Atlanta, volumes dropped by 13% w/w with spot rates dropping a further $0.02/mile to $2.13/mile.
Inbound Atlanta volumes are now down 13% m/m after four successive weeks of decline.
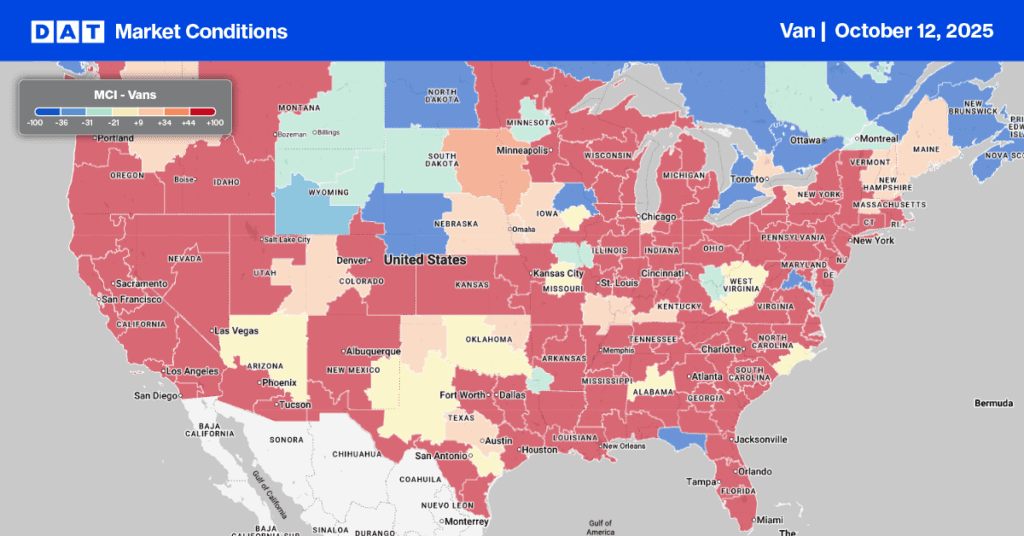
Van trends
> Learn more about the Market Conditions Index
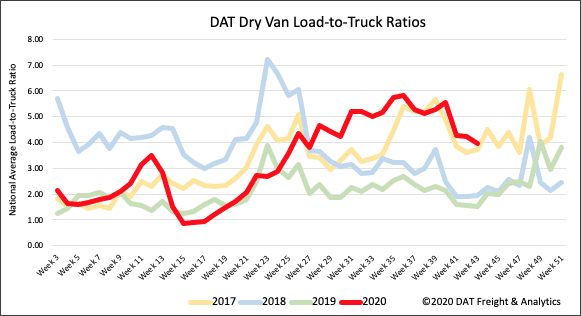
The dry van load-to-truck ratio (LTR) decreased for a third consecutive week from 4.23 to 3.97 loads per truck. Dry van load postings dropped by 4% again last week, but remain 132% higher y/y.
Available capacity showed signs of loosening as 3% more trucks posted for loads last week, but this is still 12% fewer truck posts compared to the same week in 2019 – a sign of just how tight overall capacity is at the moment.
Dry van spot market rates remained flat again last week around the $2.23/mile mark excluding FSC. Rates are still 50% higher y/y and the highest we’ve recorded in the last five years, but now that load post volumes are declining, there seems strong resistance to moving much higher.
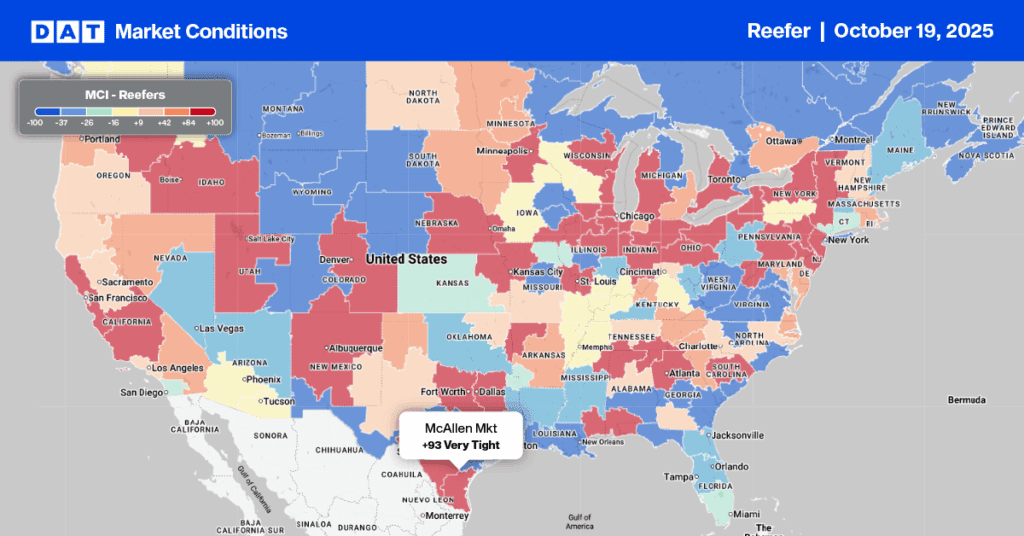
Reefer trends

> Learn more about the Market Conditions Index
The domestic produce season continues to cool with weekly average truckload shipments down 8% m/m, but in contrast, weekly imported shipments are up 17% m/m according to the USDA.
Regionally, the potato harvests in Oregon, Washington and Idaho, which supply around 62% of U.S. production, is about 25% completed with growers rushing to get their crop into storage to meet year-round shipping demand. According to Potatoes USA, “total store potato sales for quarter three increased by 13.6% in dollar sales and 10.6% in volume sales, compared to the same time frame in 2019”.
Reefer truckload capacity in the Pacific Northwest is still tight with spot rates staying around the $2.32/mile mark, while regional volumes were up 13% w/w.
In Twin Falls ID load post volumes were up 20% w/w pushing up rates by $0.02/mile to $2.44/mile.
Further south in the “Winter Salad Bowl” of Yuma AZ, volumes are up 54% m/m and 12% w/w causing reefer rates to jump by $0.17/mile to $2.29/mile.
In our top 10 refrigerated markets load post volumes were down again by 3% last week. Leading the way was the Atlanta market (#2) where volumes dropped 21% w/w although capacity was tighter with rates rising $0.03/mile to $2.30/mile. Reefer volumes in the number one port market in Elizabeth NJ dropped 10% w/w, driving rates down $0.01/mile to $2.13/mile.
Capacity is still tight on the west coast with reefer rates in Ontario jumping $0.09/mile to $3.12/mile, even though reefer volumes fell by 10% w/w.
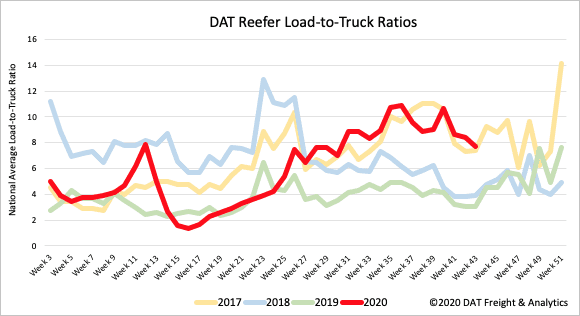
Last week’s reefer LTR dropped by 8% from 8.41 to 7.72 following a 6% plunge in load posts. However, we saw truck posts increase by 2% w/w, even though there were still 8% fewer truck posts last week compared to the same time in 2019. This is a signal that reefer capacity is tighter than last year but is starting to loosen as the produce season winds down.
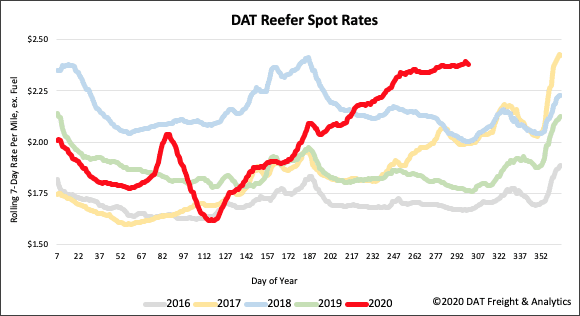
Spot rates in the reefer sector plateaued last week, hovering around the $2.38/mile mark. Since October 1st, reefer spot rates have not moved up or down by more than $0.01/mile, but compared to last year’s $1.76/mile at this time, rates are still $0.62/mile higher.
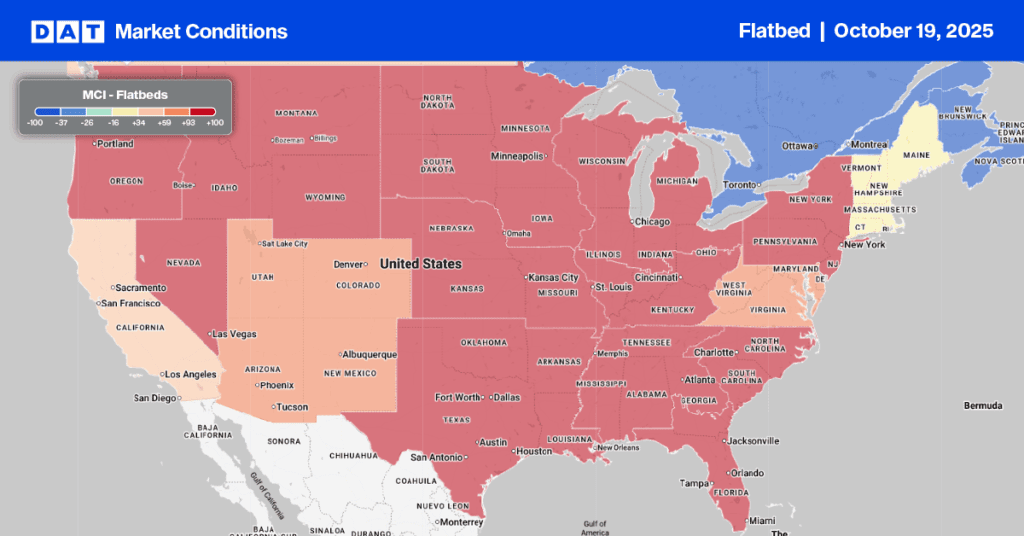
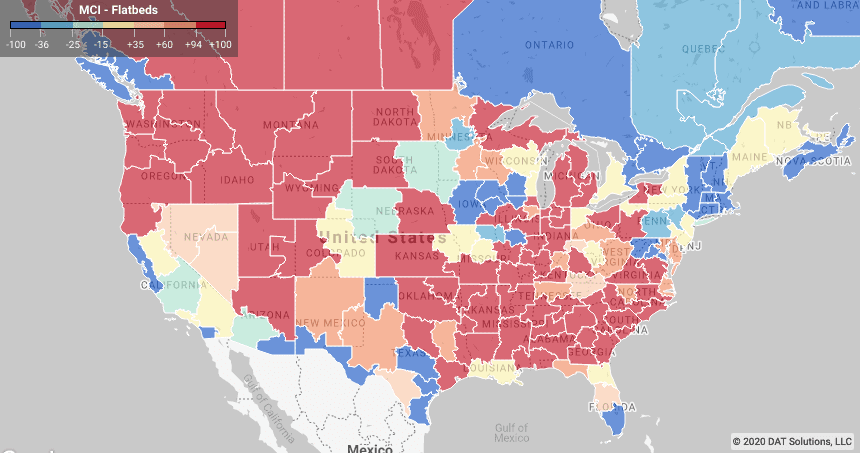
Flatbed Trends
> Learn more about the Market Conditions Index
For flatbed carriers the most recent manufacturing data releases offer some insight into where demand is headed. Last Friday’s IHS Markit U.S. Manufacturing PMI Index reported the manufacturing sector continued to report solid growth in October. This marks the fourth successive monthly expansion with a similar story emerging from the latest durable goods order data.
According to the Census Bureau, new orders for capital goods increased by 1.9% in September along with shipments of manufactured durable goods, which reported a gain of less than one percent.
There was little change in total outbound load post volume in our top 10 flatbed markets. The number one flatbed market is still Memphis where flatbed load post volumes increased by 3% w/w, although capacity loosened considerably forcing rates down by $0.11/mile to $2.86/mile.
Next door in Little Rock volumes decreased by 4% and so did rates, decreasing by $0.03/mile to $2.74/mile.
In the large softwood lumber market in Medford OR, volumes increased by 1% w/w, but capacity was very tight with rates shooting up $0.37/mile to $2.80/mile.
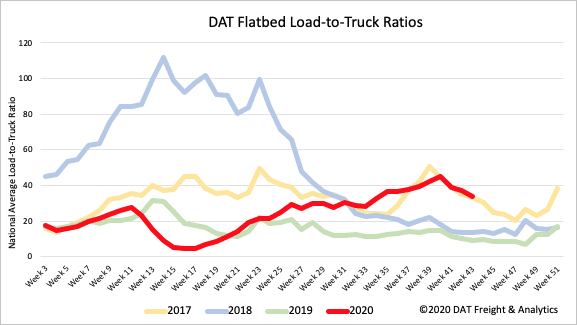
Following a 5% drop in load posts and 6% increase in trucks posting for loads, the flatbed LTR decreased by another 10% last week from 37.15 to 33.53. Compared to the same week in 2019, there are 31% fewer trucks posting for loads.
We still look to 2017 as the best overall guide for seasonal LTR trends, even though we’re comparing two different economies in terms of what’s driving demand in 2020.
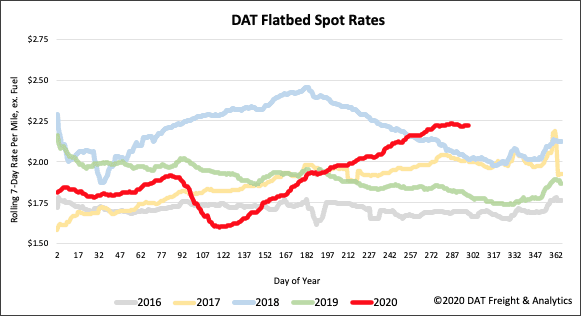
Flatbed spot rates stayed level last week ending the at $2.22/mile, excluding FSC. Similar to the refrigerated sector, flatbed spot rates have been trading in a narrow $0.02/mile band since the start of October. Today’s rates are $0.43/mile higher than the same week in 2019 when flatbed rates were $1.79/mile.
Need more information….
Our update will be refreshed next week, or sooner if conditions change materially. We recommend that readers visit dat.com/MarketUpdate for the latest information. Any questions on this report or market conditions can be emailed to askIQ@dat.com.
We are also making available, free of charge, the DAT Daily 50 which is a daily report of the top 50 lanes by volume with a week’s worth of history and predictions using the Ratecast model.