The U.S. Bank Freight Payment Index is a quarterly publication representing freight shipping volumes and $31.4 billion in freight spend on national and regional levels in the truckload and less-than-truckload sectors.
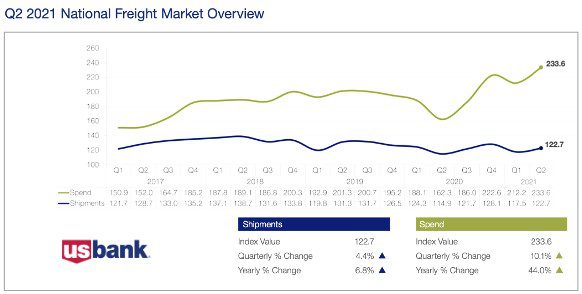
Both the U.S. Bank National Shipments and Spend Indexes posted gains in Q2. This shows that the national truck freight market is improving and suggests that the recovering economy is gaining momentum.
Get the clearest, most accurate view of the truckload marketplace with data from DAT iQ.
Tune into DAT iQ Live, live on YouTube or LinkedIn, 10am ET every Tuesday.
However, while the shipments index posted a quarterly 4.4% and annual 6.8% increase compared to the same quarter in 2019, shipment volumes are still down 6.5%.
The quarterly report notes:
“As industries ramp up output from increased demand in the second half of the year, truck freight demand will grow as well. The challenge for the motor carrier industry will be meeting that demand in the face of one of the largest supply crunches in history. Increased new driver training and rapidly rising pay will help, but it will take time to get additional drivers into the market.”
The West leads the way as imports continue to surge at historic levels
All regional shipments indexes posted gains in Q2. This contrasted with Q1’s results, which varied on how some areas of the country and industries emerged from the pandemic at different paces. U.S. Bank noted:
- The Midwest and Northeast freight markets are recovering at slower rates than the South and West regions.
- The largest quarter-to-quarter increase among the regions was the West (7.1%), while the smallest increase was in the Northeast (1.5%).
- The largest year-over-year increase was 20% in the Southeast, while the Midwest experienced the worst, contracting 2.1%.
- All regions recorded sequential and double-digit year-over-year spend increases with quarterly gains ranging from 7.9% in the Midwest to 14.6% in the Northeast.
The West Regional Shipments Index increased by 7.1% in the second quarter, after a 10.2% decrease during the first quarter of 2021. Compared to the same time last year, shipments are up 12.1%. This is driven by solid retail sales, robust home construction and strong import container volumes, which were up 30% year-over-year in June.
Over one third of imports from Asia arrive in the Ports of Long Beach and Los Angeles, as retailers scramble to import more consumer goods. The West Region is also the second largest (~25% of annual total) in terms of single-family housing starts. It’s the most freight-intensive of all residential dwellings for flatbed carriers.
According to the June report from the Census Bureau, single-family home starts are up 27% year-over-year in the West Region. Although sequential volumes were flat in June, 197,000 more single-family homes were constructed in Q2 compared to the same quarter in 2020 — a 32% increase.
West Coast shippers have been facing escalating spot and contract rates. But they’re also now being hampered by port congestion, unloading delays and more recently tightening intermodal capacity. The resulting impact has pushed spot rates close to $5.00/mile this week on ecommerce lanes, including Los Angeles to Phoenix. This contributed to the surge on the West Regional Spend Index, which increased by 13.9% this quarter and 51.5% annually and underscores just how tight capacity is for West Coast shippers.
How did other regions fare in the second quarter?
The truck freight market was strong in the Southwest during the second quarter. Shipments increased by 6.5% and spend went up by 34.1% compared to the first quarter this year.
In contrast, shipments in the Midwest were only up 2% in Q2 but dropped 2.1% year-over-year. This was due to auto production constraints resulting from the ongoing microchip and other supply chain input shortages.
The Northeast Region recorded a similar result to the Southwest with shipments up 1.8% in Q1 but down 1.8% year-over-year.
The Southeast Region recorded the largest annual increase in shipments among the five regions, increasing by 5.8% in Q2 and up an impressive 20% year-over-year.