Abandoning their lean-inventory strategy, grocery stores and supermarkets have begun stockpiling groceries in readiness for a possible surge in Fall and Winter COVID-19 cases.
That’s just another wrinkle for a fall and winter holiday retail season that’s already full of unknowns. That season includes Halloween, Thanksgiving, Black Friday, Small Business Saturday, Cyber Monday, Super Saturday and Christmas – all events that typically create higher demand from truckers to haul freight.
The accelerated inventory build-ups add yet another dimension to an already disjointed freight market, as manufacturers work to avoid the inventory failures seen in March this year.
Retailers have also started holiday sales earlier, as consumers who are resistant to going out to shop begin to do more of their holiday shopping online earlier this season. Large retailers including Kohl’s indicated that the company is anticipating early holiday demand beginning in October. Target CEO Brian Cornell also said, “we will be spreading our best price holiday offers over a longer timeframe, in order to cater to customers, who start holiday shopping in October.”
Tune into DAT iQ Live, live on YouTube or LinkedIn, 10am ET every Tuesday.
How this impacts the overall long-term truckload market remains to be seen. For those hauling retail-related freight, volumes should remain high through year-end, but for those hauling manufactured goods, expect slower volumes to continue. The most recently released August reports for three of the more consistent and reliable freight volume indicators provide some more clarity into truckload demand:
FMIC Pulse Signal: DAT iQ reported that the amount of freight moving under spot increased by 80% from August 2019, even though total freight volume decreased slightly by 3% year-over-year in the dry van sector. Consistent with recent USDA truckload shipments of produce, which were down 12% y/y last week, FMIC refrigerated volumes are also down 10% y/y in August.
ATA Truckload Tonnage Index reported that tonnage is down 3.4% y/y even though some carriers on the consumer side of the economy are generally seeing strong freight volumes. In contrast, carriers in industrial and energy industries are seeing softer volumes.
CASS Freight Shipments Index: Volumes improved in August, increasing by 8% m/m but remain down 7.6% y/y. Overall, CASS expects freight volumes to, “ move back closer to year-ago levels in the coming months, although we think it will stay in negative territory until 2021”.
On the demand side, many experts, including Deloitte, are forecasting holiday retail sales will be up about 1.5% compared to 2019 even though most U.S. consumers are in worse shape than they were last holiday season. Deloitte contends that retail spending should still rise in 2020 as consumers redirect spending on travel, eating out, and other entertainment to more holiday retail shopping. All good news for carriers in the retail sector, but for carriers heavily dependent on industrial manufacturing where freight shipments are down 7.8% y/y according to the U.S. Census Bureau, freight volumes should continue to be slow.
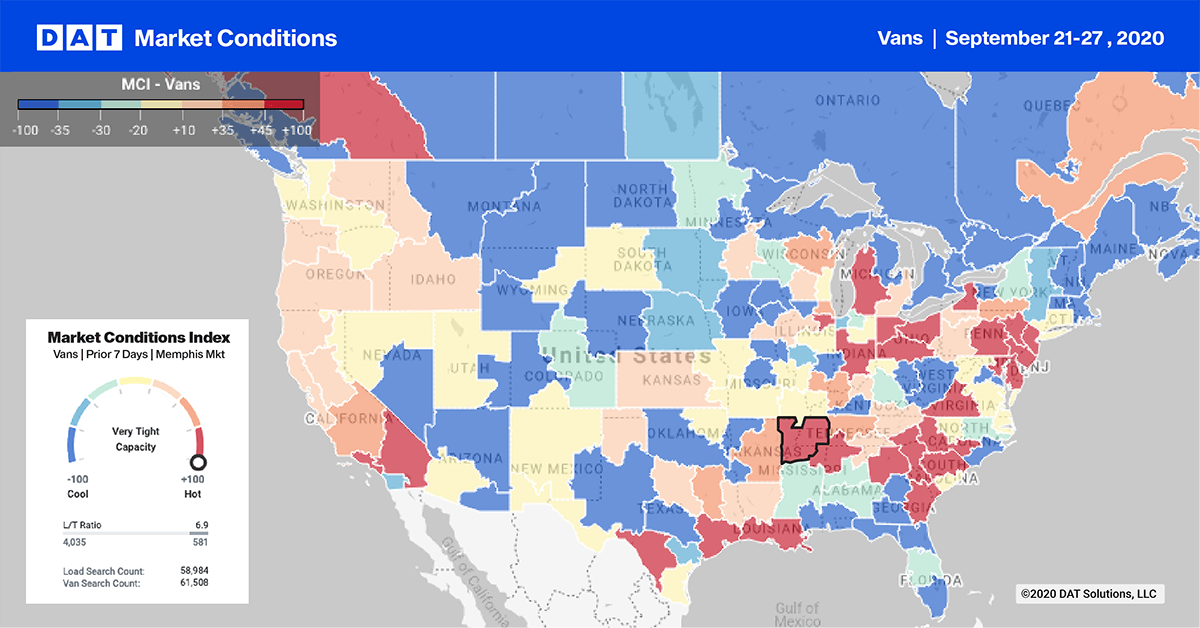
Dry van trends
> Learn more about the Market Conditions Index
To highlight the volatility in truckload volumes, the latest August U.S. Census data for manufacturing shipment values for durable goods are down 9.39% y/y, with commodities varying greatly. For example, July shipments of textiles, apparel, paper, printing and plastic products are down on average 5.25% y/y whereas computers, electronic products and equipment, and household appliances are up 1.22% y/y.
Freight volumes will not only vary depending on where the domestic manufacturing of these goods takes place, volumes will additionally vary by manufacturer as they implement physical distancing of workers to meet COVID-19 related safety requirements, slowing down production lines in the process.
On our dry van Market Conditions Map, we’re seeing this play out in multiple markets including on the West Coast in Los Angeles and Ontario markets where outbound load post volumes are up 14% w/w. Notable destinations included the larger warehouse markets of Phoenix and Stockton, which received around 7% and 5% of loads respectively.
On the East Coast, the port market of Savannah, GA, recorded an 18% w/w increase while further north in Grand Rapids, outbound load volumes increased by 13% w/w following a substantial influx of freight from the Pendleton, OR, market four weeks ago. In the Midwest, outbound volumes in Denver cooled slightly dropping by 3% w/w while in contrast, inbound volumes increased by the same amount last week with around 15% of loads coming from Ontario, CA.
Spot rates
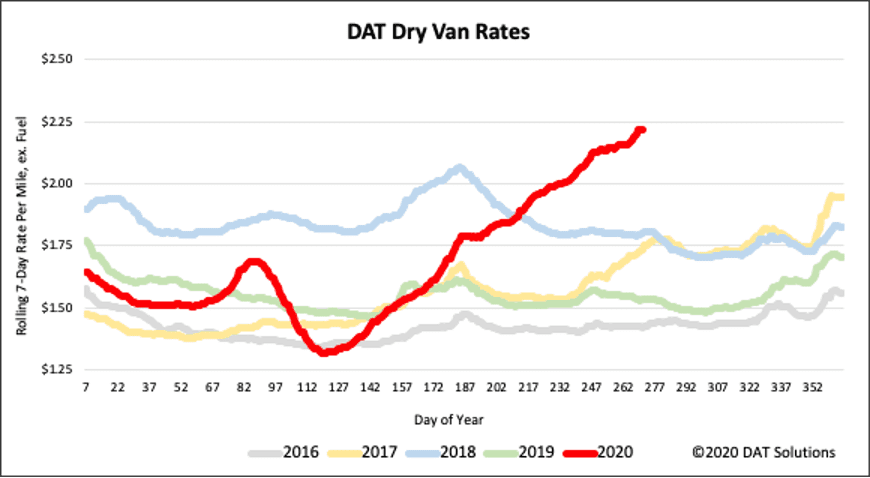
Spot market rates stayed around $2.22/mile last week, which is the first week in almost the last five months where rates haven’t continued to climb at a consistent rate. Could we be seeing a plateauing of rates in the dry van sector suggesting some steam may be going out of the spot market? It’s a little too early to call given demand in the consumer-packaged goods (CPG) sector is still very strong amid growing concerns of a rise in COVID-19 cases in Winter and subsequent restrictions possibly being implemented.
Clouding the truckload outlook is this week’s news from The Conference Board, which reported the Consumer Confidence Index declined in August for the second consecutive month. “Consumer spending has rebounded in recent months but increasing concerns amongst consumers about the economic outlook and their financial well-being will likely cause spending to cool in the months ahead.”
National average rates provided by DAT iQ.
Reefer trends
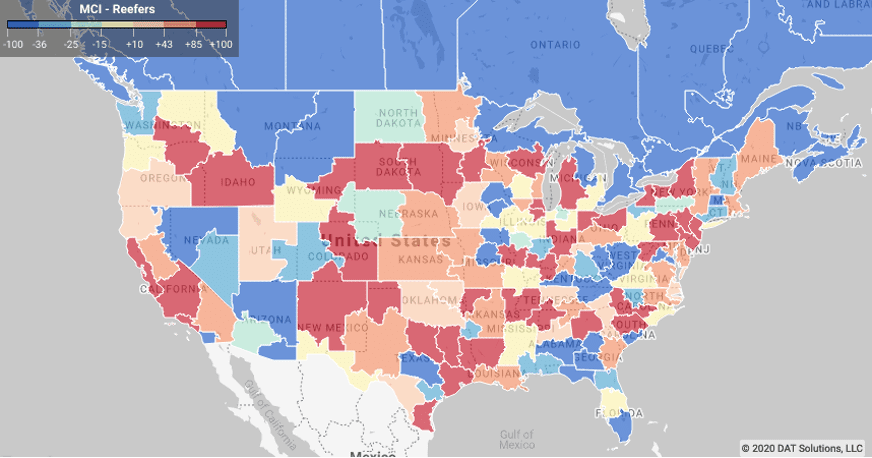
> Learn more about the Market Conditions Index
For reefer carriers, the pandemic has created the same types of volume volatility that we’ve seen for dry van, just across different types of commodities. For example, the volumes for fresh produce have been lower this year, but that’s been offset by higher demand for frozen food, with consumers purchasing products that have a longer shelf life. Dairy products have also been up, while meat, poultry and seafood are down.
Meanwhile, produce volumes are still strong on the West Coast. Grapes are the number one fall season fruit out of Fresno, CA, and those are in season along with carrots, lettuce, strawberries and avocados.
Imported pineapples, tangerines and oranges from Chile continue to arrive in the Philadelphia market, but reefer capacity is fairly loose there which has put a drag on freight prices. Outbound Philadelphia rates are now down 11% m/m. Avocado growers in South Florida are in the middle of peak shipments, which occurs between August and November. Load posts out of Lakeland and Miami, FL, are up 8% w/w.
Spot rates
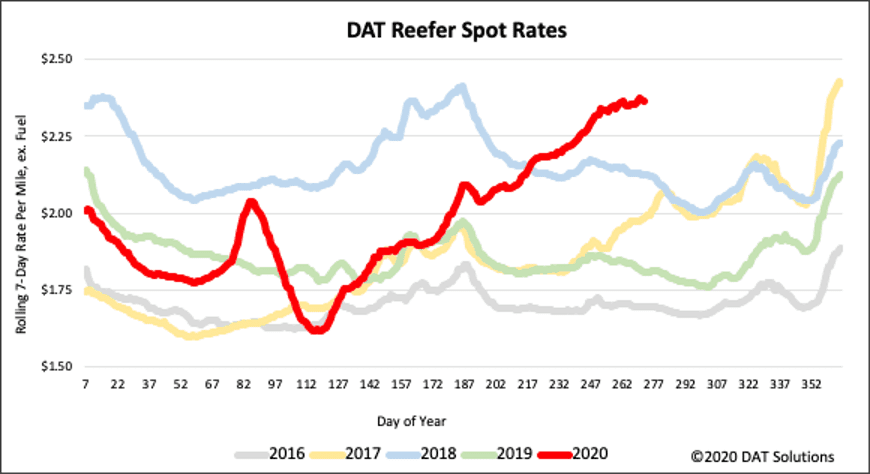
National average reefer rates seem to be settling around $2.36/mile excluding FSC, with a definite plateauing trend emerging last week. Spot rates are around 5 cents lower than the peak in 2018, which coincided with the typical mid-year peak in the produce shipping season.
This year the reefer rate rally has extended two months longer than in any normal non-pandemic year. Even though frozen food volumes are on the rise, they won’t be sufficient to offset declining produce volumes and keep upward pressure on spot rates as we head deeper into Fall and Winter.
National average rates provided by DAT iQ.
Flatbed trends
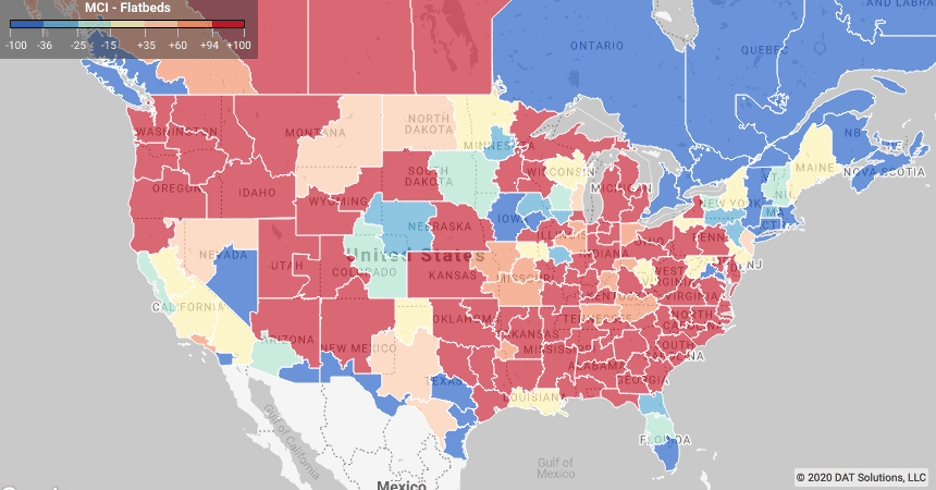
> Learn more about the Market Conditions Index
With the exception of wood products, where shipments were up 1% y/y, most manufacturing shipments suited to flatbeds – including, primary metals, fabricated metal products and machinery – were down on average 8.1% y/y, according to the U.S. Census Bureau. There are signs of improvement, though, with shipments in August down just 2.5% m/m compared to double that for the prior month.
Farm, construction and energy-related machinery have been hit the worst during the pandemic. August shipments are down 13%, 19% and 18% y/y respectively.
Flatbed volumes continue to climb In the Southeast freight markets in Georgia (Atlanta and Macon) where outbound load post volumes are up by 13% w/w and 22% m/m – 13% of loads were destined for Richmond VA, 7% to Pittsburgh and 9% to Lakeland FL. In the Pacific Northwest, outbound load volumes are up 17% w/w with 18% of loads destined for Southern California and 4% of loads destined for Phoenix.
Spot Rates
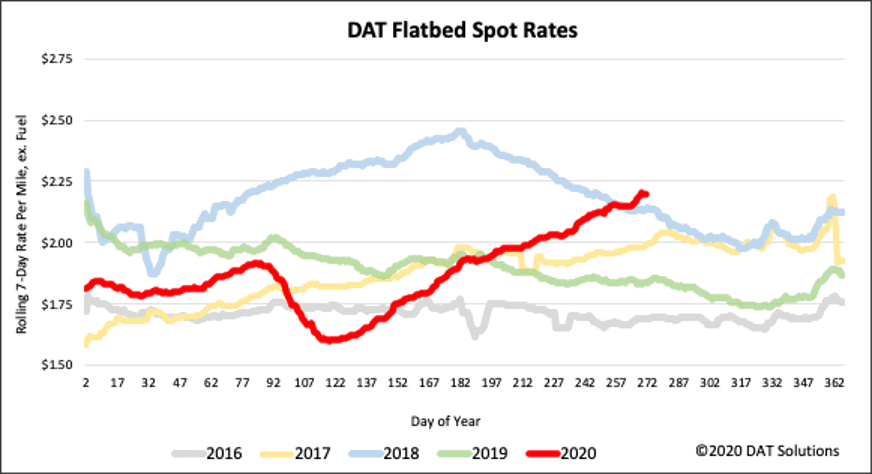
Flatbed spot rates inched higher again last week increasing by to $2.20/mile, excluding fuel. Spot rates are now 6 cents higher than this time in 2018, with signs there’s some emerging resistance to move much higher as we get further into Fall and colder temperatures.
National average rates provided by DAT iQ.