In a lot of ways, the current imbalances in freight networks reflect the divided purchasing habits of two very different groups of consumers.
On the one side, there are constrained spenders whose incomes have been negatively impacted by the pandemic, according to the latest consumer spending report by Nielson Intelligence unit leader Scott McKenzie. On the other side are insulated spenders whose incomes remain unchanged by the pandemic. It’s similar to the same way motor carriers have been affected differently depending on the commodity they haul.
Nielsen’s global marketing research efforts capture consumer spending behavior at the point of sale and note that even though year-to-date sales in the consumer packaged goods (CPG) sector are up by $62 billion – representing a 13% increase over sales in 2019 – they have been slowing steadily over the last five months. Nielsen’s point-of-sale data shows that, while the size of the average weekly shopping basket is 11% above average compared to 2019, it has steadily declined from peak pandemic levels in March.
Like many commodities DAT has been tracking since the pandemic began, CPG, building materials, lumber, food and beverages and paper products all follow a familiar M-shape, where load volumes spiked at the start of the pandemic, crashed during lockdown, then spiked again as economies reopened and retailers rushed to restock depleted inventories. Nielsen reports that consumer buying habits are changing in real-time, whereas typically it takes months and even years for consumers to adjust.
The latest Monthly Retail Trade Survey from the U.S. Census Bureau explains in part why some shippers and carriers in the CPG sector report higher year-over-year freight volumes, whereas others in the industrial manufacturing sector report the exact opposite. Non-store retail or e-commerce sales in July were up 24.7% year over year. In contrast, clothing and department stores sales were down 20.9% and 13.4% respectively.
The most interesting aspect of the Nielsen report are the survey results, which indicates consumers expect a continuation of their current buying patterns for another six to 12 months and are “hunkering down for a bit of a long haul.” This suggests the DIY trend will continue, with wild fluctuations in freight volumes driven by higher demand for longer shelf-life CPG products, but depressed demand for others, adding more uncertainty for shippers, brokers and carriers.
Dry van trends
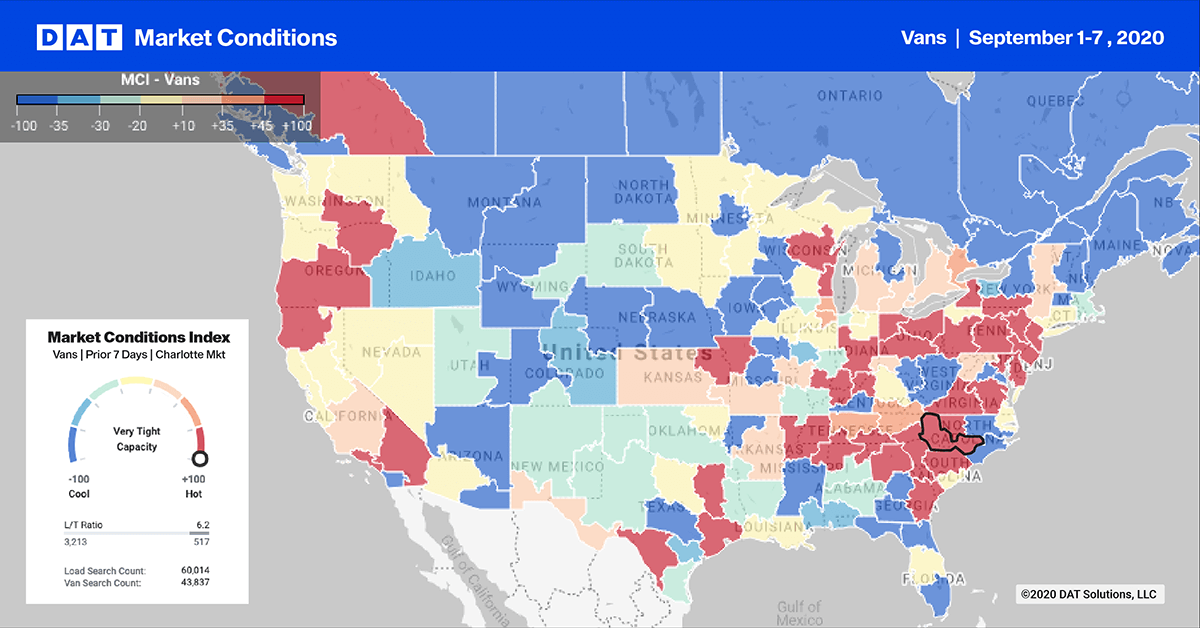
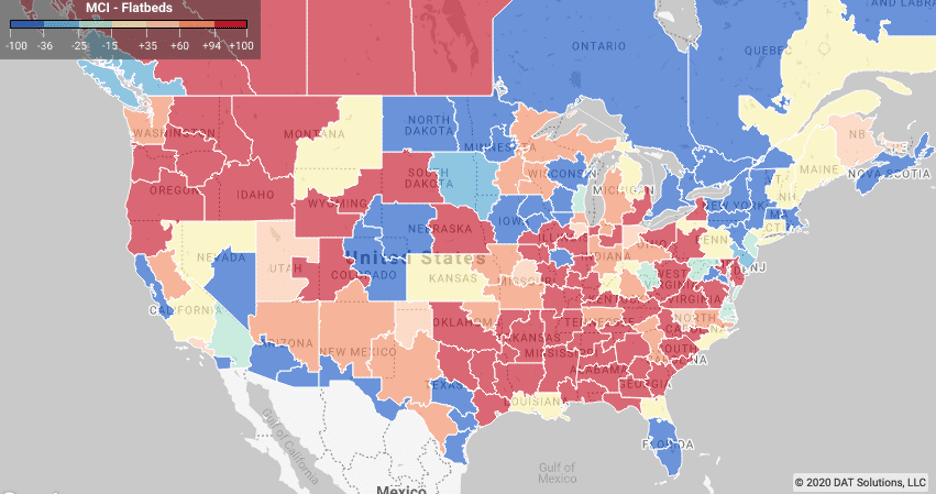
Market Conditions maps are availble in DAT Power and DAT RateView
According to time and attendance software provider Homebase – key economic recovery metrics that track hours worked – the numbers of employees working and locations open have flatlined since mid-June at around 20% below pre-pandemic levels. This in part explains why contract freight volumes are at best flat overall or even down slightly year over year based on recent ATA and CASS reports.
Complicating freight forecasting is the COVID-19 pandemic and how various industries are impacted in different ways and at different times. This is reflected in the market imbalance we see across all freight markets, driving higher spot market volumes and rates. Adding more volatility to the market is the recent announcement by Union Pacific to add surcharges to small West Coast shippers for any surge volume over and above committed contract volumes.
Railroad equipment capacity is already tight on the West Coast, forcing intermodal shippers to look to LTL and truckload markets to move high-value volume for their core customers. How much intermodal volume moves to road remains to be seen on critical lanes, including Los Angeles-Chicago and Los Angeles-Dallas, but adding to the capacity shortage is also the shortage of 53′ intermodal containers and TOFC (trailer on flat cars) railroad equipment.
TOFC is also seen as a source of capacity for large asset-based motor carriers to move road freight by rail during busy times, so with the major railroads exiting this unprofitable segment, small shippers may have no choice but to move retail season freight by road in the coming weeks.
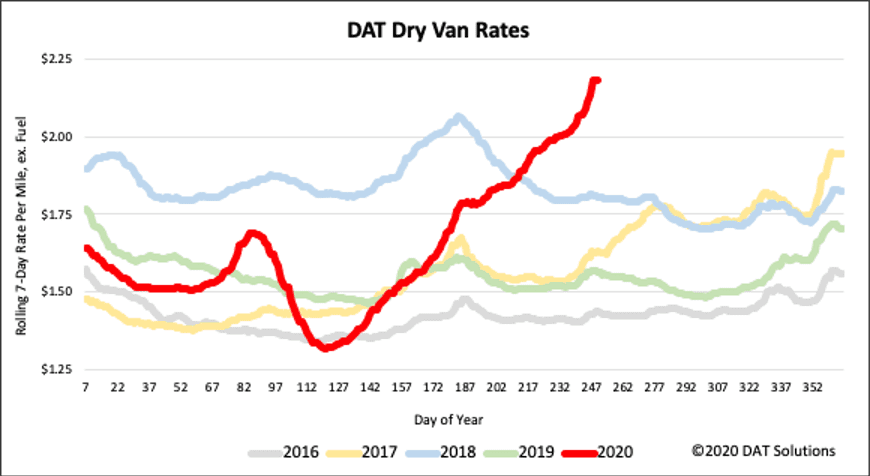
Spot market rates surged again last week in the lead-up to the Labor Day holiday weekend, ending at $2.18/mile (excluding fuel), representing a 5% w/w increase. Rates for the first week of September are 28% higher than the same time in 2019 and the highest recorded in the last five years.
> Learn more about rate forecasts from DAT iQ
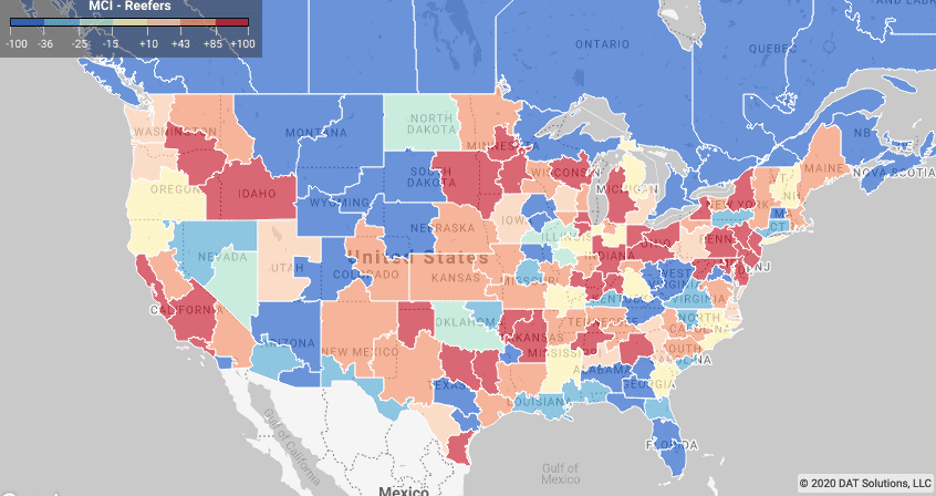
Reefer trends
Since early July, weekly truckload shipments of produce have been down around 8% y/y on average, which has translated to just over 3,000 fewer truckloads each week, according to the USDA. Despite lower volumes of produce this season, DAT has seen higher refrigerated freight volumes on the spot market as a result of a surge in consumer packaged goods, including non-durable goods that have been in high demand during the pandemic. This includes all meats, poultry and frozen food products, which have featured heavily in consumer spending as more consumers elect to cook meals at home instead of eating out at restaurants.
According to Nielsen’s IRI CPG Demand Index for the week ending 8/23, edible and fresh foods are reporting double digit growth compared to this time last year, with frozen goods continuing to report the strongest growth in the edible food department (longer shelf-life of frozen products allows consumers to stock up and limit trips to the store).
Adding to reefer truckload volumes this season has been the USDA’s $3 billion Farm to Families Food Box Program, which will result in produce growers shipping an estimated 60,000 truckloads of fresh produce, dairy and meat to food banks and non-profit organizations by the end of September. Load volumes in all of our produce-heavy markets are strong, especially on the West Coast in the Fresno market where outbound freight volumes are up 8% w/w.
Capacity is also tightening along with outbound rates, which have also increased by 6% m/m. On the Gulf Coast, refrigerated shippers got back to work after Hurricane Laura, which resulted in outbound volumes increasing by 2% w/w although capacity was tighter than expected driving up spot rates by 8% w/w.
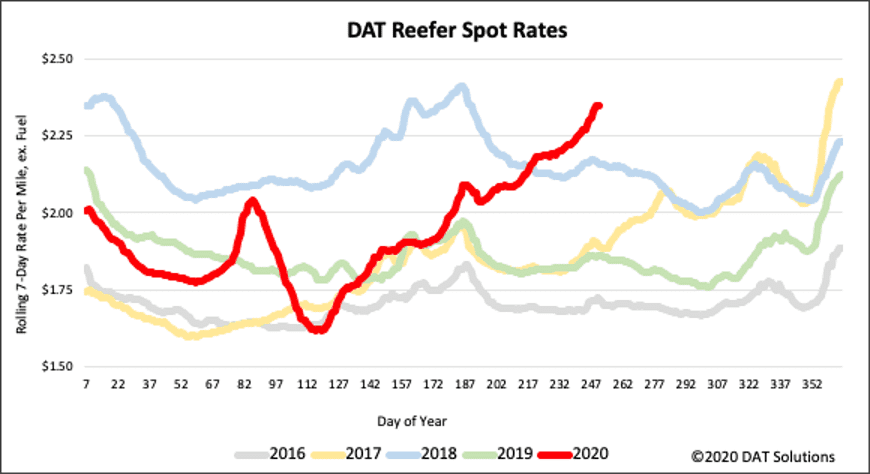
National average reefer rates increased by 3% w/w to reach $2.35/mile (excluding fuel) right before the Labor Day break – the highest level in the last five years for the start of September.
> Learn more about rate forecasts from DAT iQ
Last week’s U.S Census Bureau report on construction showed spending increased slightly by 0.1% in July on private projects, which was largely offset by a drop in public construction projects. The report noted that spending on private construction projects increased 0.6% as a result of a strong homebuilding market amid record-low mortgage rates. Boosting flatbed volumes this summer, spending on residential projects surged 2.1% in July.
There was also more good news for flatbed carriers last week, with news the drilling recovery is underway following a 27% m/m increase in new well permits in Texas, according to POIM Consulting. Well permits are an indicator of future drilling, as are the number of drilling rigs being recorded by Baker Hughes – the latest report shows that drilling rigs are down 73.6% y/y, with most of that decrease occurring since March when the pandemic began to take hold.
With oil above $40/barrel, companies can start to make money in the energy sector, which makes both the rig and new permit count data points to watch closely for flatbed and bulk tank carriers. Each new well requires an estimated 1,300 to 1,500 truckloads of freight from start to finish, which includes machinery for site prep, fracking sand, chemicals, water, casing & drill pipe, lifting, logging and pumping equipment as well as waste removal.
Inbound flatbed volumes in the Permian Basin oil markets of Lubbock and Albuquerque reflect the increasing level of drilling activity increasing by a combined 4% w/w and 53% m/m.
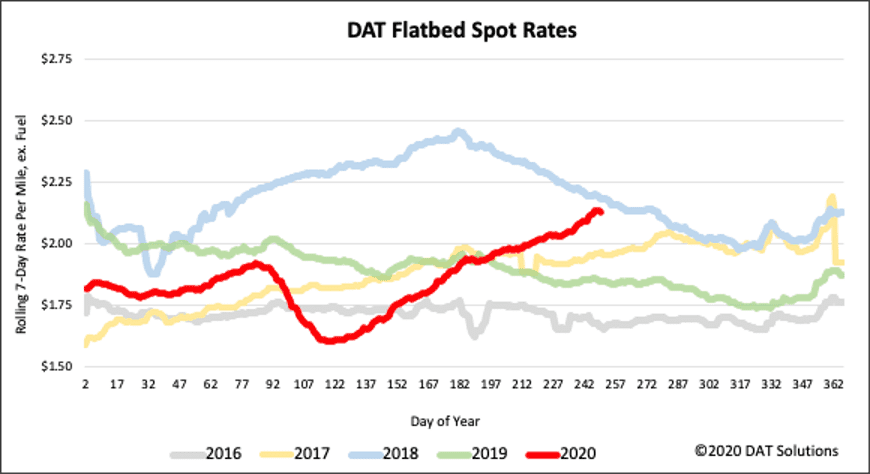
Flatbed spot rates are approaching record high levels for this time of the year after increasing by 2% w/w to $2.13/mile (excluding fuel), just 5 cents lower the five year record in 2018. Flatbed rates are now 13% higher y/y.


